The German DAX Composite (DAX) has been in a strong uptrend since bottoming last October at 8354.97. During its resurgence, the DAX ran into resistance at the 10000 area (10093.03 to be specific) before continuing higher. This new leg higher has taken the index to the 11000 area where it has been consolidating in a tight range – you can see this in the contracting Bollinger bands. A trading range of 10500-11000 or so may develop before the next leg higher. Note that key support resides around 10000.
German DAX vs EURO
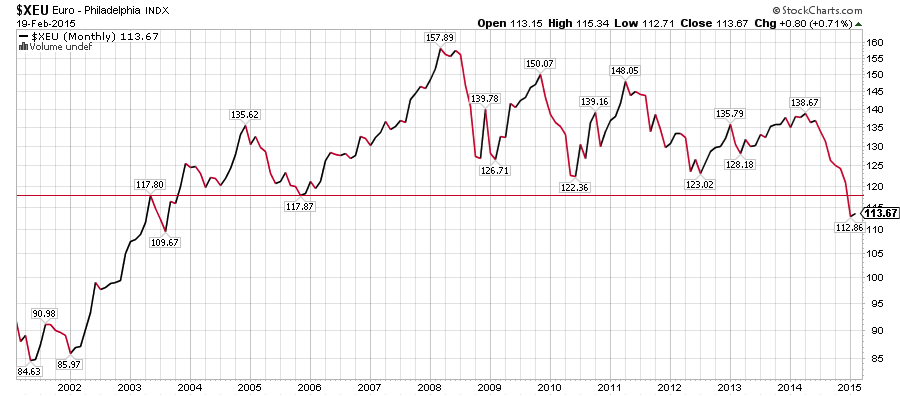
As can be seen on the above chart the strength of the German equities market has coincided with a weaker Euro and certainly the trend in the Euro is still negative and likely to stay in a down trend as Europe moves forward with its announced version of QE (quantitative easing). In the below long term chart of the Euro we can see that a critical support area around 117-118 was broken which opened the door for a test of the 109-110 area. With monetary easing and a weak Euro, German equities have caught a nice tailwind, as exports become more affordable to countries with stronger foreign currencies.
EURO Currency Monthly Chart 2001-2015
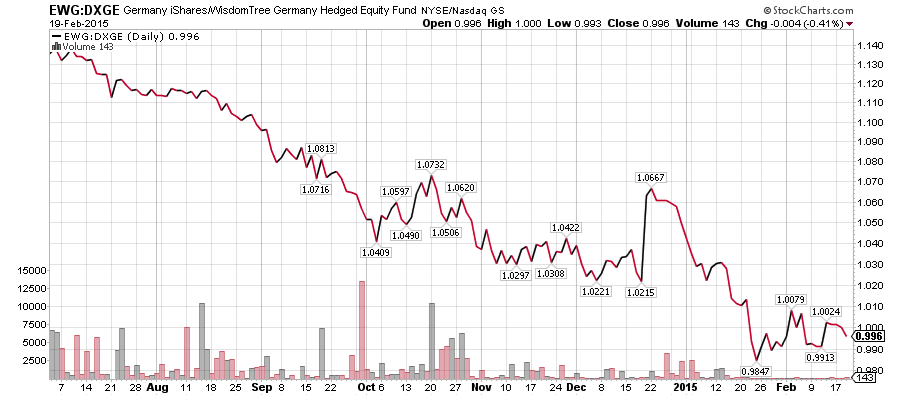
Digger a bit deeper and looking at ETFs that focus on German equities, there is the very popular Germany iShares (EWG) or the Wisdom Tree Germany Hedged Equity Fund (DXGE). In the below chart we can see the underperformance of EWG to DXGE. The reason for this is that DXGE hedges the currency exposure to what has been a weak Euro. So from a relative strength view it’s clear that DXGE has been outperforming and, if trends continue, is the better choice.
EWG vs DXGE chart
And finally let’s look at the chart of DXGE, which mimics the performance of the German DAX very well. We can see the breakout in mid January and the tight consolidation taking place currently. Support sits at 27.50-28.00 area. A break above 29.66 should signal the continuation of the uptrend.
DXGE germany hedged chart 2014-2015
Thanks for reading.
Follow Karl on Twitter: @Snyder_Karl
No position in any of the mentioned securities at the time of publication. Any opinions expressed herein are solely those of the author, and do not in any way represent the views or opinions of any other person or entity.


")