Today’s lesson will look at GDP Per Capita, and economic data point that helps keep things in perspective.
The most common statistic used to measure the size and growth rate of a nation’s economy is Gross Domestic Product (GDP). However, GDP as most commonly used can be a flawed measurement if one tries to infer that the size or growth of economic activity is well correlated to the prosperity of its people.
Consider China and the United States for example. The U.S. has a GDP of approximately $16.5 trillion and a population of roughly 325 million while China has a GDP of nearly $11 trillion and a population of approximately 1.4 billion. One could say that China’s economy is about two-thirds the size of the U.S. economy. However, when one considers how that activity is spread amongst the citizens, China’s economy is only one-seventh that of the U.S. Accordingly, Chinese citizens are clearly less productive and prosperous than U.S. citizens.
GDP per capita (per citizen), as demonstrated above, is a valid way to measure the efficiency of one nation’s economic output versus another and is also an important statistic to gauge the productivity and prosperity trends in one country. We have frequently shown the declining trend in secular GDP growth in charts like those shown below.
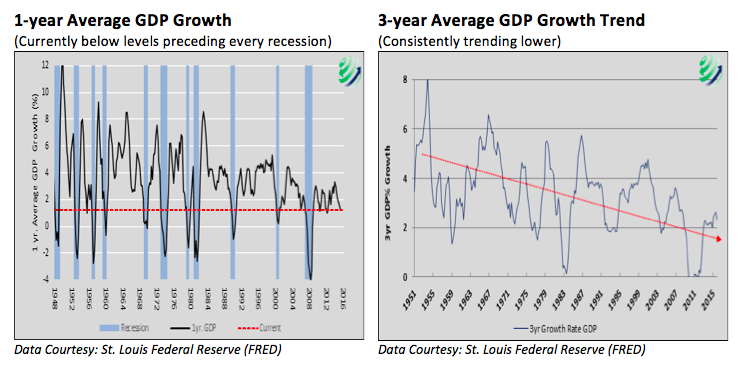
Above, GDP is plotted on an absolute basis and does not take into account the amount of economic activity or economic growth per person. Below, we show the ten-year growth rate of U.S. GDP per capita.

As one easily notices GDP per capita is more worrisome than when viewed on a total basis as in the first two graphs. The economic growth rate per person is currently below one half of one percent. More concerning, it is below levels seen during the great financial crisis in 2008 and it is still trending lower.
This graph confirms our macroeconomic concerns and helps explain, in part, why so many U.S. citizens feel like they are being left behind. Factor in that many of the economic spoils are not evenly distributed, as assumed in this analysis, but are largely accruing to the wealthy, and the problem only worsens. As such, the growing social anxiety and trend towards populism, be it conservative or liberal leaning, will not likely dissipate if the aforementioned economic trends continue.
Thanks for reading.
Twitter: @michaellebowitz
Any opinions expressed herein are solely those of the author, and do not in any way represent the views or opinions of any other person or entity.


