Summary: Since February, US equities have risen nearly 20%. Equities outside the US have risen 12%. A tailwind for this rally has been the bearish positioning of investors, with fund managers’ cash in February at the highest level since 2001. Similarly, their equity allocations in February had only been lower in mid-2011 and mid-2012, periods which were marked by notable lows for equity prices (i.e. S&P 500 – INDEXSP:.INX) during this bull market.
Remarkably, allocations to cash are now even higher than in February, and fund managers are now underweight equities for the first time in 4 years. Fund managers have pushed into bonds, with income allocations rising to a 3 1/2 year high in June and July. Overall, fund managers’ defensive positioning supports higher equity prices in the month(s) ahead.
Allocations to US equities had been near 8-year lows over the past year, during which the US has outperformed most of the world. That has now changed: exposure to the US is at a 17-month high. There is room for exposure to move higher, but the tailwind for the US due to excessive bearish sentiment has mostly passed. That’s also the case for emerging markets which have been the best performing equity region so far in 2016. European equity markets, which have been the consensus overweight and also the world’s worst performing region, are now underweighted by fund managers for the first time in 3 years.
Among the various ways of measuring investor sentiment, the BAML survey of global fund managers is one of the better as the results reflect how managers are allocated in various asset classes. These managers oversee a combined $600b in assets.
The data should be viewed mostly from a contrarian perspective; that is, when equities fall in price, allocations to cash go higher and allocations to equities go lower as investors become bearish, setting up a buy signal. When prices rise, the opposite occurs, setting up a sell signal. We did a recap of this pattern in December 2014 (post).
Let’s review the highlights from the past month.
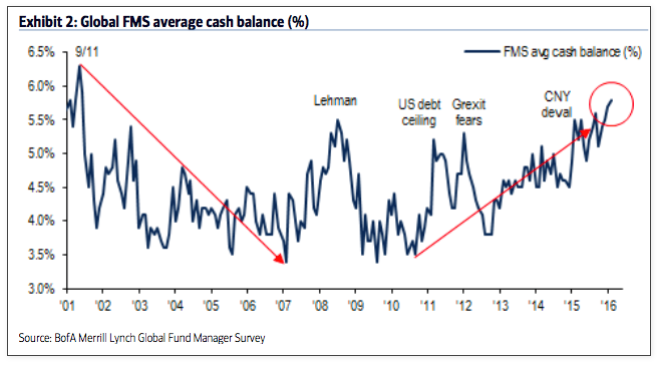
Cash: Fund managers cash levels at the equity low in February were 5.6%, the highest since the post-9/11 panic in November 2001 and lower than at any time during the 2008-09 bear market. This was an extreme that has normally been very bullish for equities. Remarkably, with the SPX having since risen nearly 20%, cash in July is now even higher (5.8%) and at the highest level in 14 years (since November 2001). Even November 2001, which wasn’t a bear market low, saw equities rise nearly 10% in the following 2 months; that rally failed when cash levels fell under 4%. This is supportive of further gains in equities.
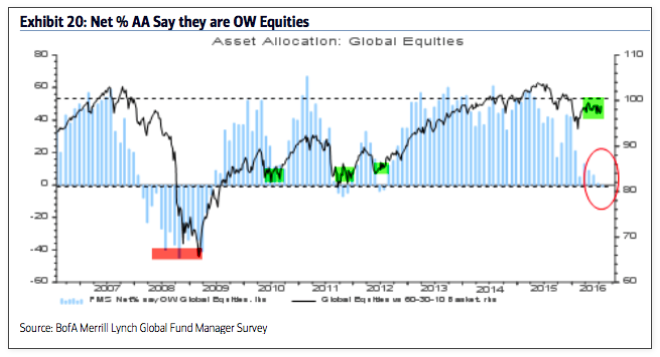
Global equities: Fund managers were just +5% overweight equities at their low in February; since 2009, allocations had only been lower in mid-2011 and mid-2012, periods which were notable lows for equity prices during this bull market. Despite the rally since February, allocations are now even lower, dropping to -1% underweight in July. This is 1.2 standard deviations below the long term mean. Fund managers are underweight equities for the first time in 4 years.
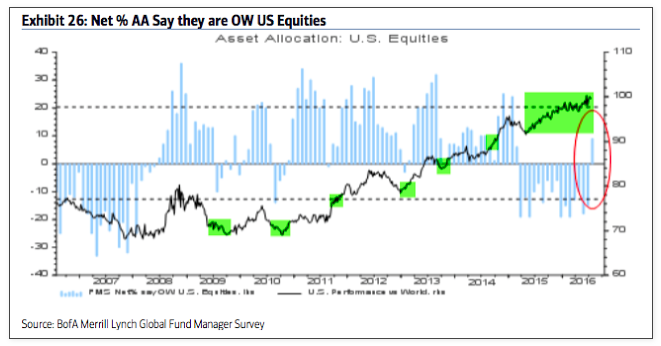
US Equities: US exposure has been near an 8 year low during the past year, during which US equities have outperformed. US equities have been under-owned. That has now changed, with allocation rising to +9% overweight, the first overweight in 17 months. There is room for this to move higher, but the tailwind for the US due to excessive bearish sentiment has mostly passed.
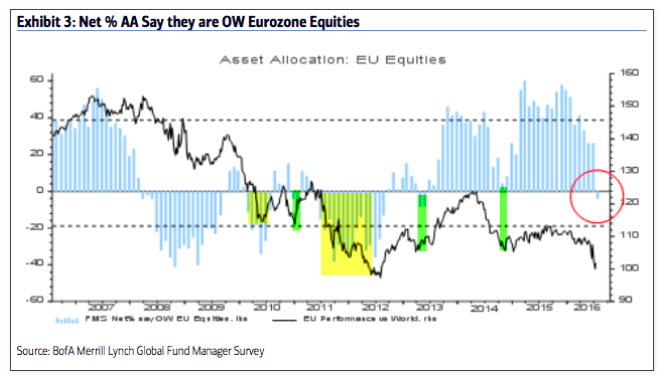
European equities: Fund managers have been excessively overweight European equities for more than a year, during which time EZ equities have underperformed. For the first time in 3 years, allocations to EZ are underweight (by 4%). The underweight can become more extreme but the largest risk to underperformance due to excessive bullish sentiment has passed.
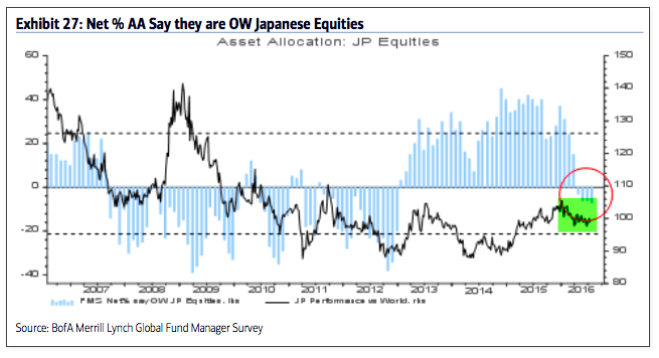
Japanese equities: Allocations to Japan have been falling but are flat m-o-m at -7% underweight, which is the lowest since December 2012. The region has been underperforming in 2016.
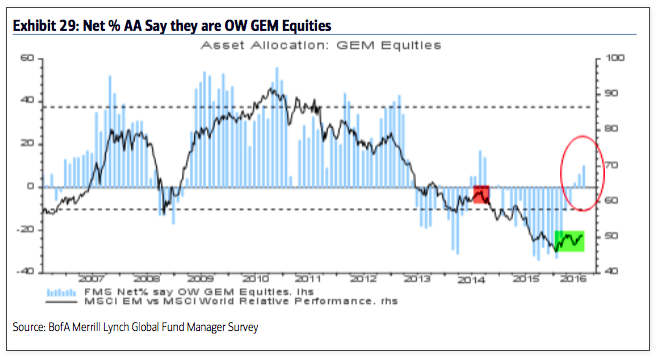
Emerging markets equities: In January, allocations to emerging markets fell to the second lowest in the survey’s history (-33% underweight), an extreme comparable only to early-2014 from which the region began to strongly outperform for the next half a year. Allocations have since risen to +10% overweight, the highest in 22 months but still 0.4 standard deviations below the long term mean. The region has outperformed the rest of the world so far 2016. There is room for exposure to increase further but allocations are now back to where the rally in mid-2014 failed.
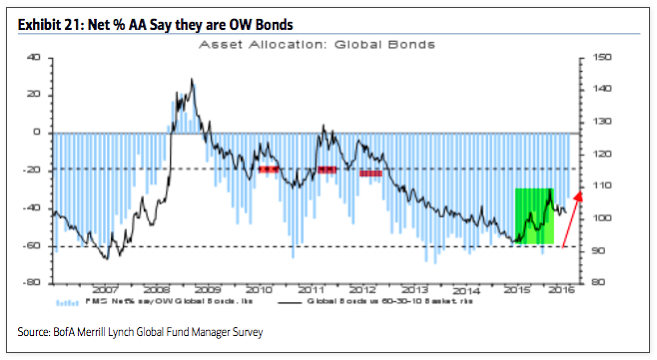
Global bonds: Fund managers are -35% underweight bonds, near a 3.5 year high allocation. This is a big rise from -64% underweight in December (a 2-year low allocation). Bonds outperformed in the 10 months before the current equity rally began in February. Note that bonds have historically started to underperform when allocations rise to -20% underweight (red shading). Current allocations are back to their long term mean.
continue reading on the next page…
")


 Rolling Over At Key Fibonacci Level?")
")
