As short-term active traders, we want to enter and exit according to the most relevant information. Earnings and quarterly projects just don’t give us the signals we need to get in and out of the markets with precision.
That being said, even most traditional “indicators” like stochastic and MACD lag price. There is however a better way, an “indicator” in the sense of the word that gives us real time, accurate information about what’s happening right now in the stock market (and what might happen in the next few minutes), that indicator is the NYSE Tick.
The NYSE Tick Index gives us the relationship of stocks up ticking versus down ticking. The Tick is an extremely useful tool for intraday traders in the E-mini’s like the S&P & Dow. Entering long near low ticks and short near high ticks can help reduce the likelihood of getting whipsawed out of a trade.
A value will be displayed typically between +1500 and -1500. This number represents the net # of stocks whose last price was up versus down. So a high tick reading of +1000 means that as of the last price, on net in the New York Stock Exchange 1000 more stocks were ticked up versus ticked down.
For Example:
If there are 3000 stocks trading on the NYSE and 1500 trade higher from their previous price and 500 trade lower than their last price the Tick will read +1000. But wait what about the other 1000 stocks? They could be unchanged from their last price.
When using the Tick we are looking for extremes to enter or exit a trade. NYSE Tick readings of +1000 or -1000 are considered very strong as we typically trade between 1000 most of the time on the NYSE.
Tips for Using the NYSE Tick as a trading indicator:
- Tick readings within |400| indicate chop, ignore them
- On a range day you can look to fade tick extremes
- A 1 period moving average can make it easier to see the trend of the Tick
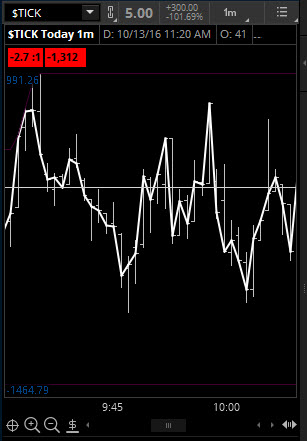
Note the extreme tick readings for the day:
- When we get a high tick and a high in price at the exact same time, this could indicate the high of the day.
- When a high tick prints without a simultaneous high price we can continue to make new highs, until a new high tick is reached (the reverse is true for a low tick followed by new lows).
So if you’re a day trader, take a look at the NYSE Tick often times you’ll find it under $TICK on your trading platform. Look at the correlation between extreme tick readings and an intraday chart of the E-mini S&P and you should be able to better pin point your entries and exits.
Thanks for reading.
Twitter: @EminiMind
Any opinions expressed herein are solely those of the author, and do not in any way represent the views or opinions of any other person or entity.
 Rolling Over At Key Fibonacci Level?")


