 Yes I am aware that EWZ (iShares MSCI Brazil ETF) is up over 19% YTD and more than 39% from the low of 38 seen in February. However, the price action yesterday and today are significant on multiple time frames and may be indicating much more upside for EWZ.
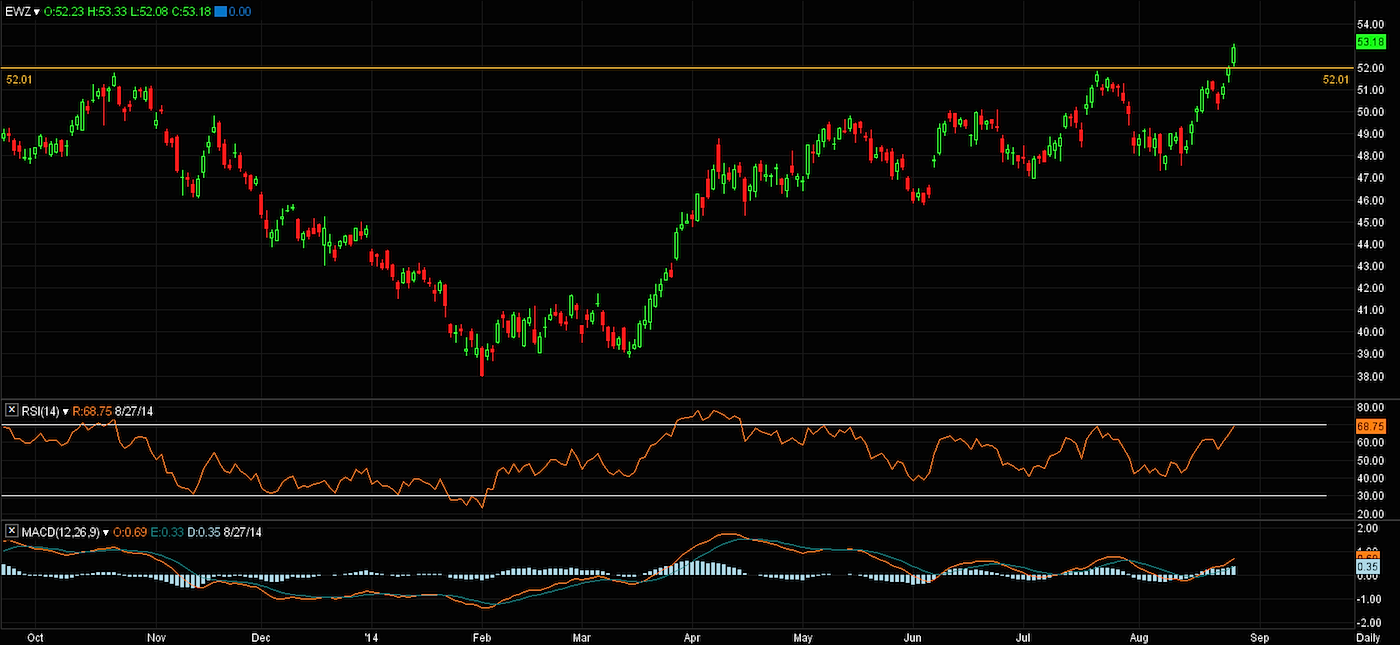
Looking at the daily chart over the past 15 months, you can see that EWZ has been challenging resistance around 52 (52.01 to be precise). After failing on successive attempts, EWZ recorded a new 52-week high on Tuesday, penetrating an open gap from May 30, 2013. And on Wednesday, EWZ closed at 53.18 and by doing so, officially closed that gap and set the stage for further upside.
EWZ Daily Chart
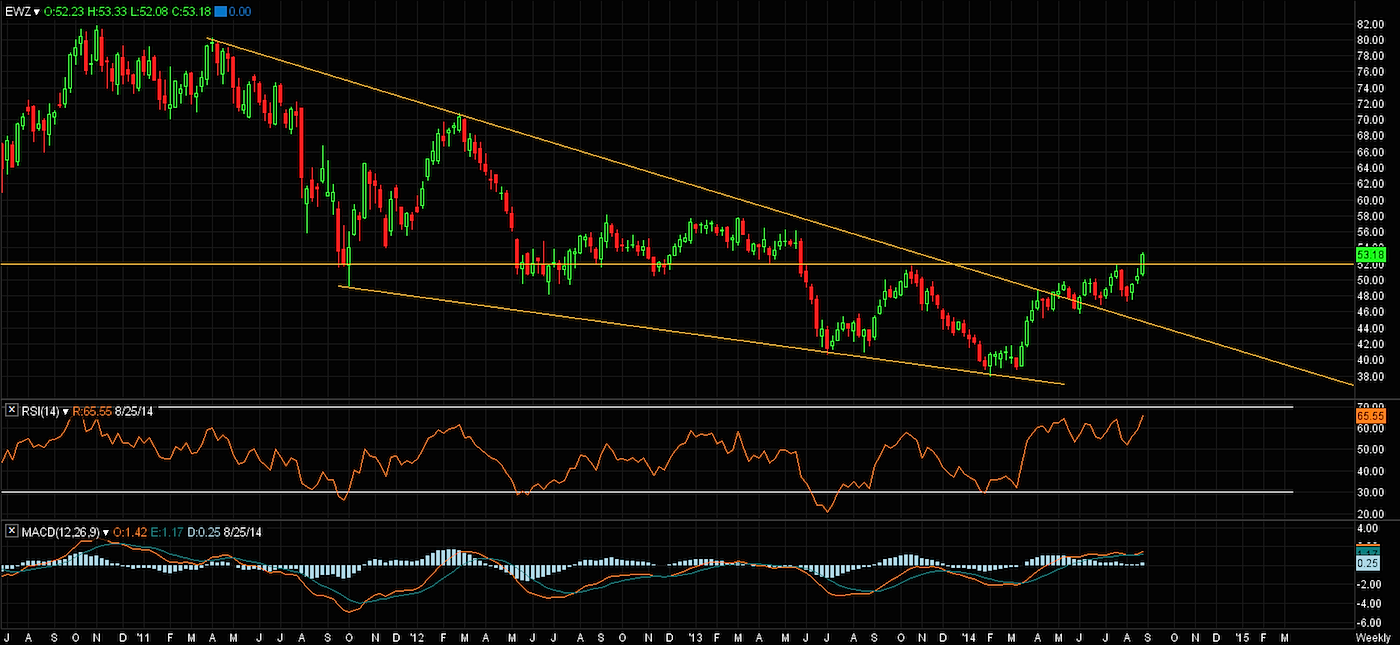
Moving on to the weekly chart, we can see a diagonal triangle that has been in place since April 2011 and further resistance at the 52 area once price was able to breakout of the pattern. So far this week, EWZ has formed a nice real body candle. A close above 53 near the top of the candle would be encouraging.
EWZ Weekly Chart
Now lets take a look at the monthly chart, wherein I have labeled the diagonal 1 through 5. This appears to be an ending diagonal which is the final pattern within a larger corrective move. This corrective action started in May 2008 and I labeled the three moves A, B, and C, with C being the ending diagonal which I have been referencing.
It is also worth noting that the RSI on the monthly chart for EWZ appears to be breaking through resistance, which has been the 50 area, another positive. Now that price is above wave 4, we can have confidence (not guaranteed) that the A-B-C move is over and price will follow an uptrend.
EWZ Monthly Chart
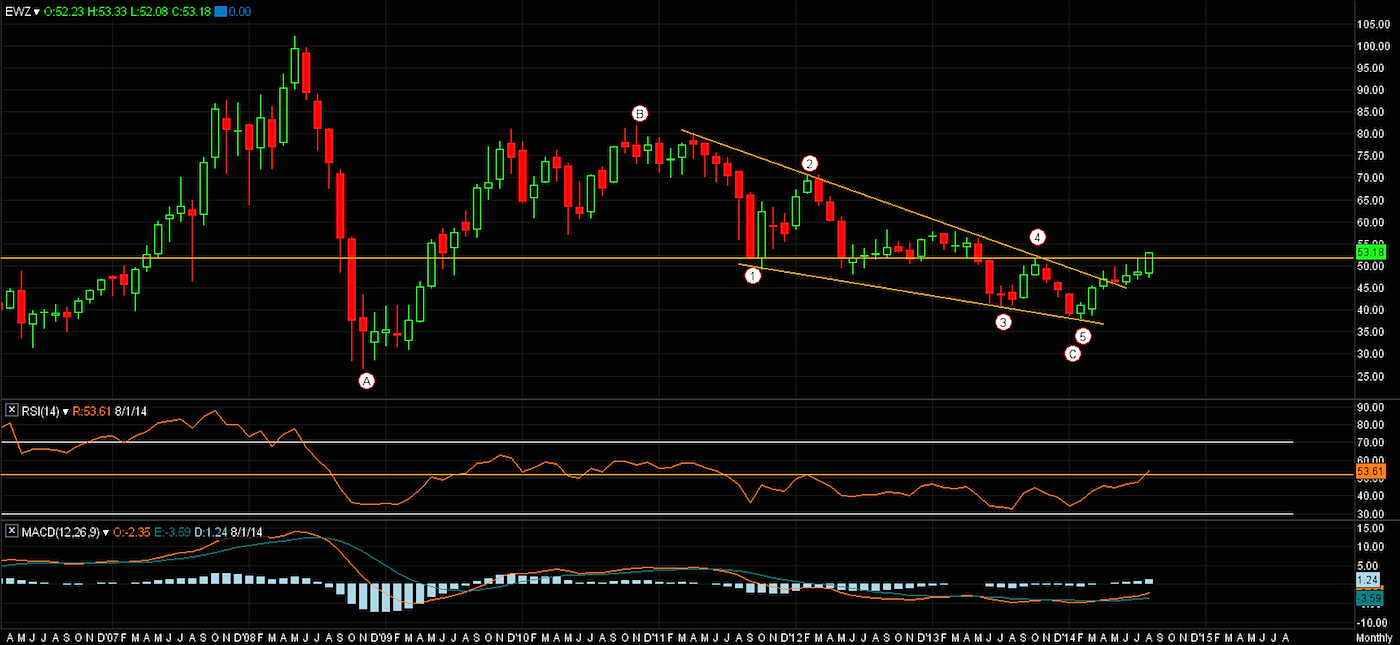
So what are the implications? With ending diagonals, a price objective can be the beginning of the pattern, which in this case is the $80 area. That in turn is a few points shy of a 78.6% retracement of wave A. Of course not all price objectives are met and patterns do fail. However with multiple time frames offering promising developments, I am optimistic on the future of EWZ.
Follow Karl on Twitter: @Snyder_Karl
No position in any of the mentioned securities at the time of publication. Any opinions expressed herein are solely those of the author, and do not in any way represent the views or opinions of any other person or entity.


")


