 EUR/USD smashed higher this morning after Eurostat’s Flash CPI estimate pegged the Euro Area’s annualized inflation rate for a third consecutive reading at 0.8%. Though less than half the European Central Bank’s (ECB) target rate of 2%, today’s print was higher than forecast and by various accounts perceived as softening recently elevated expectations the ECB would initiate a QE program of its own later in the year.
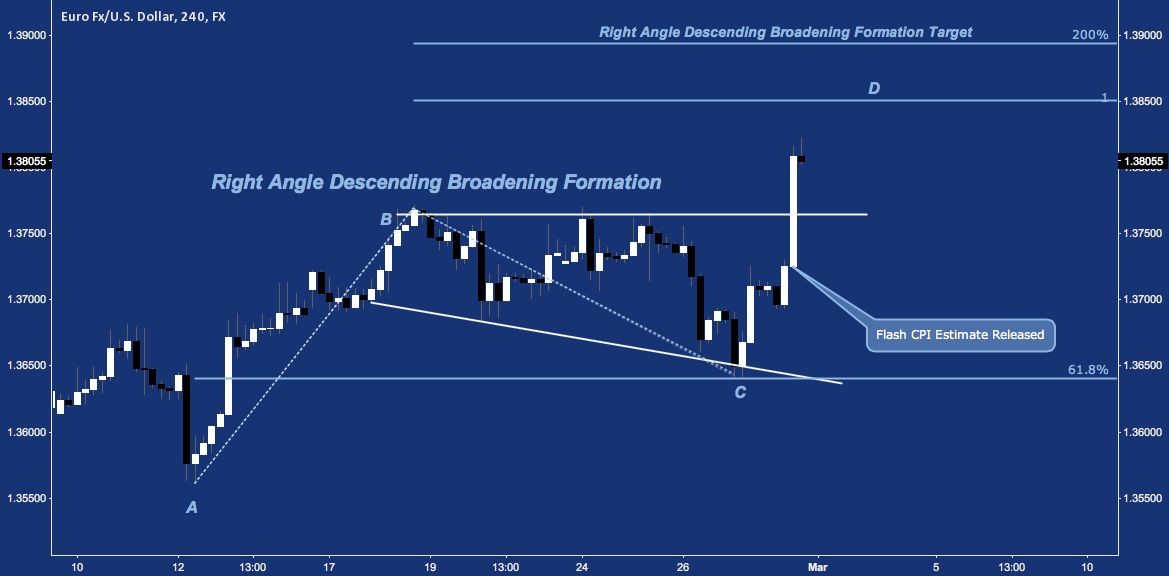
Within one minute of the release EUR/USD added 50 pips, moving from 1.3725 to 1.3776 to break out of the right angle descending broadening formation (RADBF) pattern it has muddled through during later February. Now above local horizontal resistance near 1.3760, the pair has near-term upside targets at 1.3850 (an ABCD completion) and 1.3890 (RADBF pattern target) as laid out below:
EUR/USD – Hourly: Broadening Formation Breakout
In a broader context this move brings the pair – colloquially referred to as “Fiber” – back to the 1.38-1.39 resistance window it has visited and been turned away from in October and again in December 2013. It’s third encounter in 6 months, this time around EUR/USD‘s is testing the confluence of 1) the 61.8% fibonacci retracement of 2011-2012’s 1.20-1.50 range, 2) rising wedge resistance; and 3) symmetrical triangle descending trend line resistance.
EUR/USD – Monthly: Confluence of Resistance Inside 6-Year Symmetrical Triangle
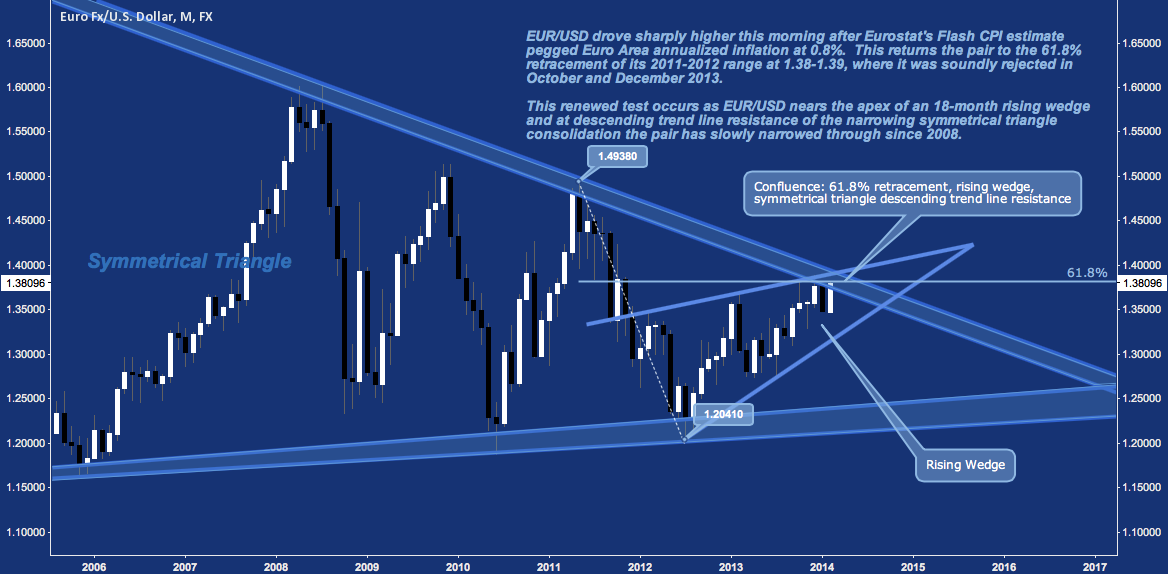
A break above 1.39 removes the key technical obstacle between EUR/USD and a retest of 2011’s highs near 1.50. On the other hand, if demand sputters out at this level as it did in Q4 2013, wedge support near 1.33-1.34 provides the first rung of support, while a break below finds last year’s lows near 1.28 as the next foothold down, followed by major long-term horizontal support between 1.23-1.25.
Twitter: @andrewunknown and @seeitmarket
Author holds no exposure to instruments mentioned at the time of publication. Commentary provided is for educational purposes only and in no way constitutes trading or investment advice.
Charts courtesy of TradingView.com
Any opinions expressed herein are solely those of the author, and do not in any way represent the views or opinions of any other person or entity.


")

")

