I believe the US Dollar Index is coming close to completing a year long “flat” corrective move and will, over the coming, weeks beginning a move higher that will likely rocket to new highs.
There, I said it. I have no idea what the fundamentals say, what Janet Yellen says, blah blah. I’m all about geometry and music – all the time. But there is a lot of interesting things happening all at once, including a potential pattern in the Euro that could shake things up. (more on the Euro below)
Here’s the corrective moves of the past… they have ALL arced out a “N” corrective move (see red lines on chart below),
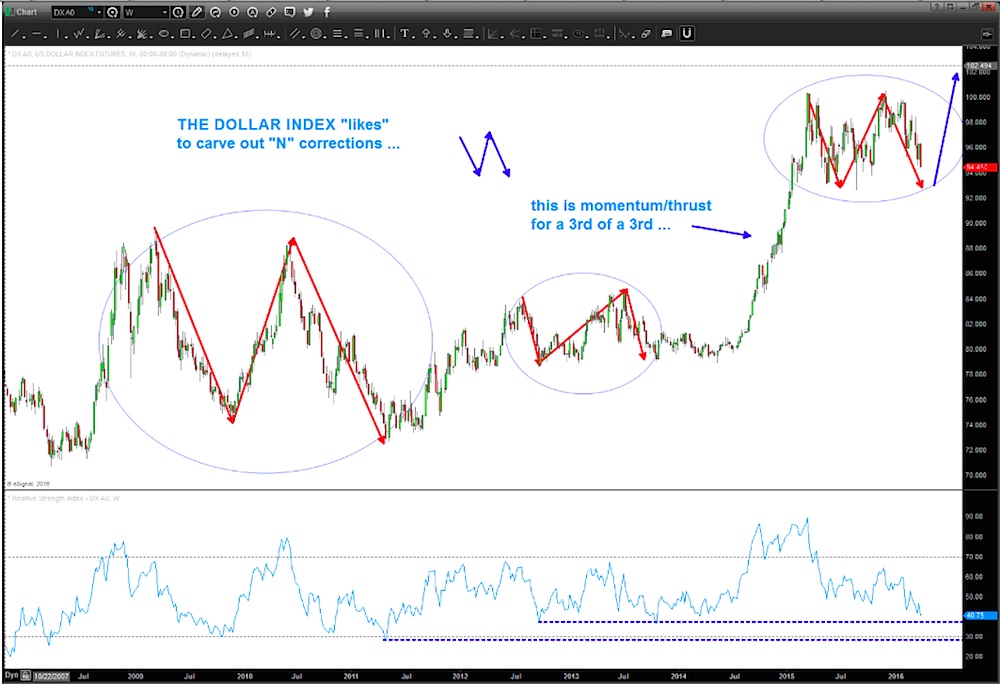
Notice as well that the US Dollar Index is nearing the lower level of the RSI (weekly)
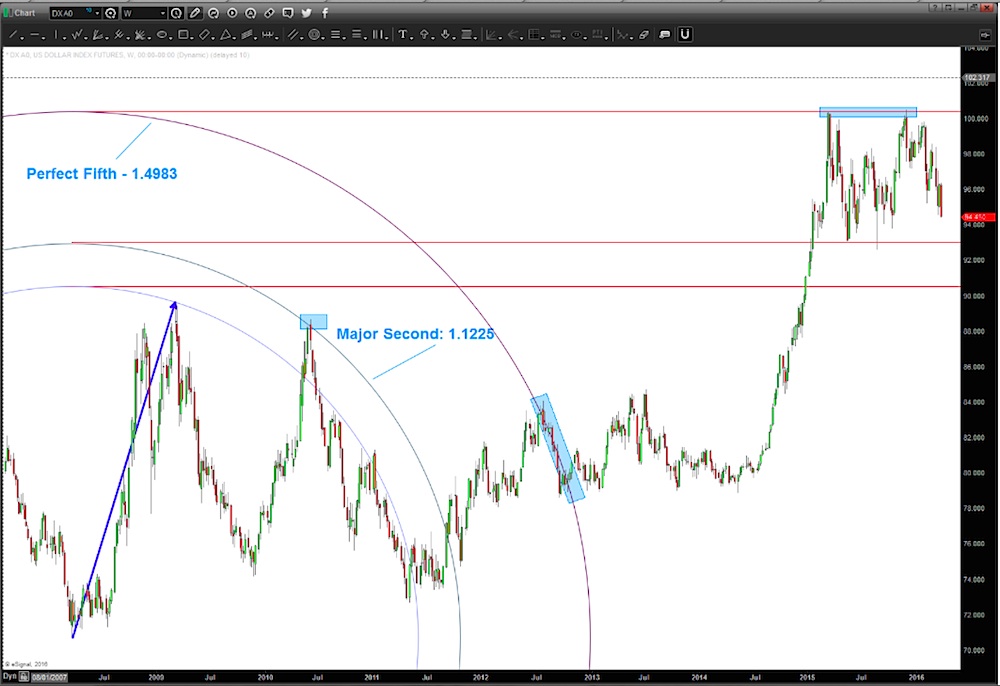
The question? Why is the Dollar holding this support? Well, music of course – see the chart below.
From the initial lows we POP up and that move is the corresponding “energy” we use to move the “waves” out .. in this case we used all musical notes from the equal octave scale of music and used “musical” polarity to project the top of the circles as both support and resistance. (see the blue rectangles)
Notice how these musical notes formed the channel of support and resistance for the USD…. cool, huh?
Knowing that the EURO makes up a majority of the USD Index – let’s see what it’s up to!
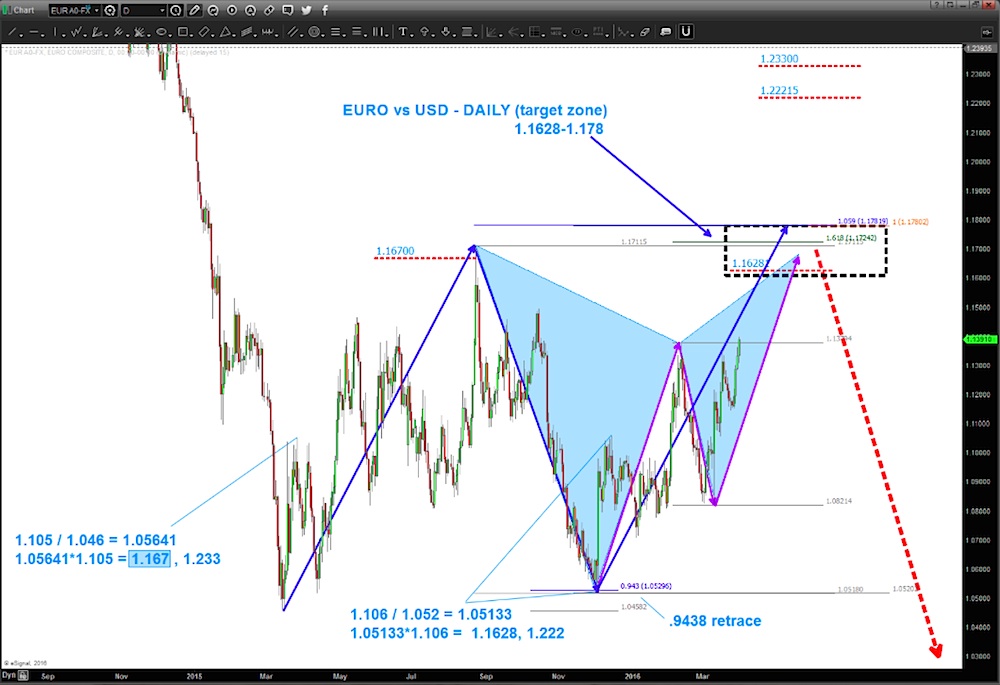
As you can see above, the triangle thesis is pretty much “out” but the formation of two very powerful patterns is occurring. I’m going to eye for 200 pips or so higher for another short opportunity.
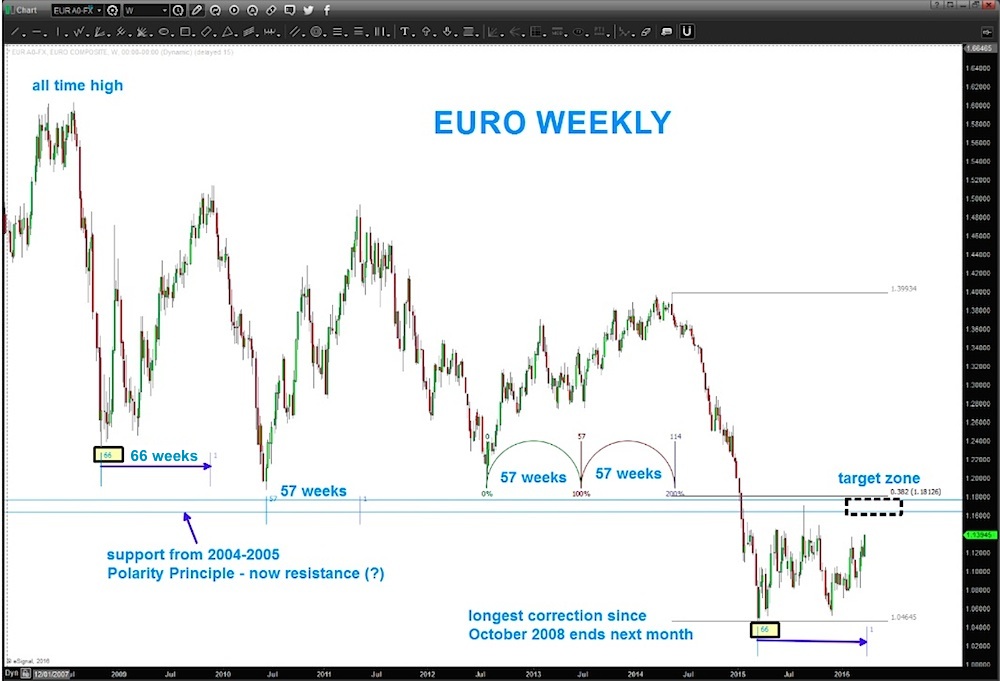
How about the longer term weekly?
If you take a peak – you’ll see that we still haven’t even reached .382 of the most recent swing high. Additionally look at the TIME of the corrections. Next week marks 66 weeks – the longest corrective TIME period since the all time high.
Also, note that the target zone comes right into VERY STRONG POLARITY RESISTANCE from 2004-2005.
Appears “bearish” doesn’t it?
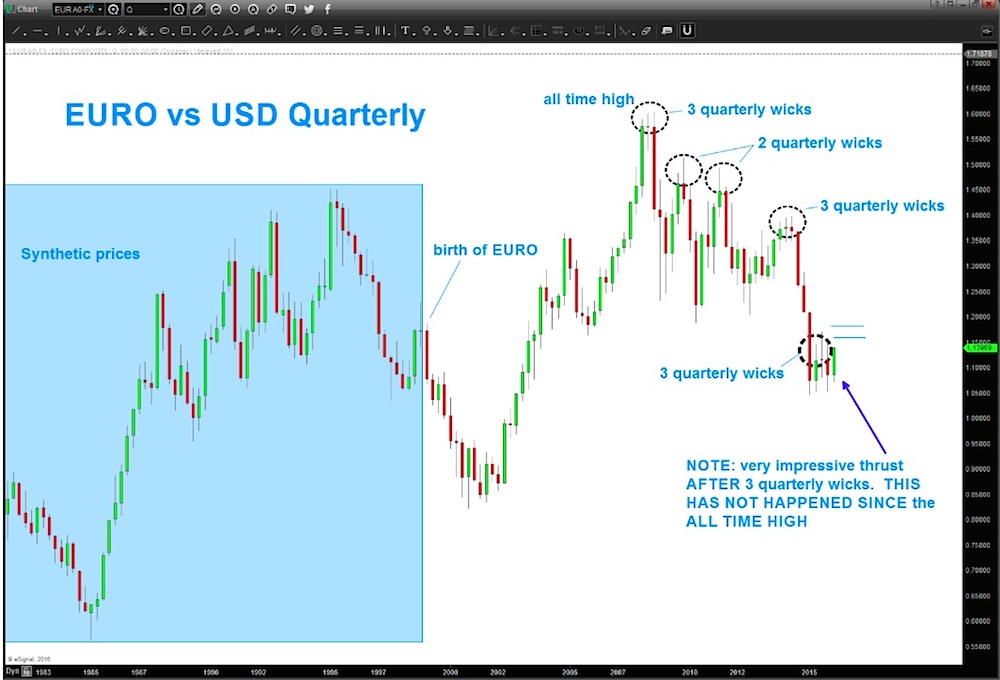
WELL, HOLD YOUR HORSES… this could be a HUGE move based on a quarterly chart of the EURO (keep reading below…)
In this long-term quarterly chart you can see that it produced 2-3 “quarterly wicks” and then dropped… THE OPPOSITE HAS HAPPENED HERE. The quarterly candle was a very strong candle. This target area shown (blue horizontal lines) must be respected to start the next leg down.
These levels will be crucial to monitor (in my opinion) and come at a very important time for the Worlds Currency Complex.
Thanks for reading.
Twitter: @BartsCharts
Author does not have a position in mentioned securities at the time of publication. Any opinions expressed herein are solely those of the author, and do not in any way represent the views or opinions of any other person or entity.

")


")