 Trading based on exchange rates can be especially rewarding because of the tendency of certain currency pairs to maintain a trend. If you find a good entry, it is often possible to leave a trade on for longer than you would with equity indices. However, one of the difficulties for newer traders (and even for experienced traders) is finding a good entry with confirmation before the move picks up speed. It’s easy to be left behind, which also makes it tempting to chase a move later than one should.
Since the Euro and the U.S. Dollar Index essentially have an inverse relationship, a trader can achieve a real edge by charting both products simultaneously. The advantage is enhanced if one uses a pattern-based methodology such as Elliott wave, which is our preferred approach.
We do not simply mean that the Euro and the U.S. Dollar Index charts are mirror images of each other, although they are very nearly so. The turns in both products often arrive at about the same time, but more importantly, an ending pattern or a continuation signal in one product often coincides with a complementary development in the other. The trader/analyst gets twice as much information to confirm a trading scenario, and twice as many opportunities to notice if the scenario is wrong.
For more than a year, we have been treating the rise in the U.S. Dollar Index as a developing impulsive (five-wave) move. This is consistent with our expectation that more market participants will come to view the Dollar as a relatively safe harbor for wealth during the next two years. As price approached our main target at 90.44 for the first sub-wave of that move, both the Dollar and the Euro appeared to be forming ending patterns on a faster time frame, suggesting that retracements were due.
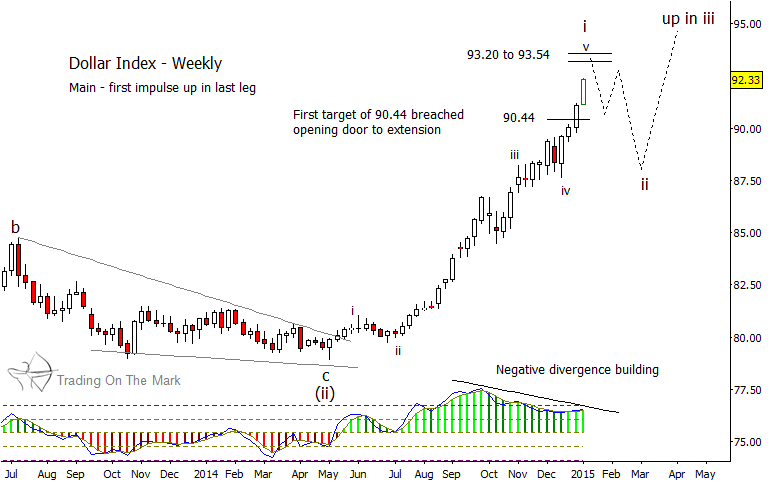
However, even before the Dollar reached its initial target for wave i up, the Euro fell through our 1.2273 target for the equivalent wave (i) down. That provided the first warning sign that the markets were not setting up for the forecasted reversal.
The chart below shows the support levels that are most likely to have an effect on the Euro looking ahead to January and possibly February. We believe the area near 1.1521 is the most likely to produce a short-term wave (ii) reversal, and that area also coincides with support calculated based on a monthly chart (not shown). However, all three of the support levels on the chart are candidates for the location of the turn. To catch what we believe will be a tradable bounce, we will continue to fine-tune the pattern analysis on daily charts for both the Dollar and the Euro.
Note also the growing divergence between lower prices in the Euro and higher readings on the “commodity channel index” momentum indicator. There also is a similar signal on the Dollar Index chart. We treat that kind of momentum divergence as an exhaustion signal, and we will have more to say about the uses of the CCI in future articles.
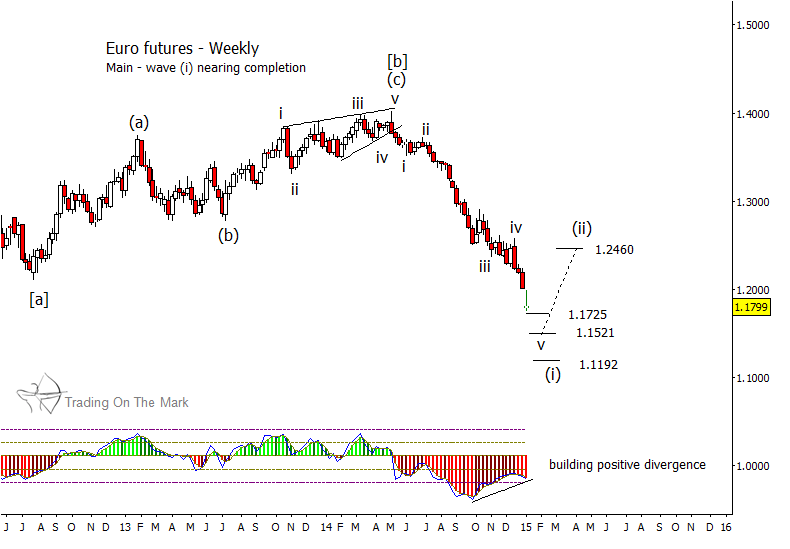
The upward target shown for wave (ii) in the Euro is speculative based on the assumption of a bounce from 1.1521. We will be able to calculate a more reliable target after the wave (i) low has been put in.
Tomorrow, we will post Dollar and Euro charts on a higher time frame at our website, Trading On The Mark, to give more context for the Elliott wave counts shown here.
Note: We are excited to be able to share our charts and analysis with readers at See It Market. Our objective is to help you succeed in your trading, and we welcome your thoughts and questions about our posts.
Follow Tom & Kurt on Twitter: @TradingOnMark
No position in any of the mentioned securities at the time of publication. Any opinions expressed herein are solely those of the author, and do not in any way represent the views or opinions of any other person or entity.


