Today I want to provide a quick update to my post last week here on See It Market on the energy sector and, in particular, the XLE and XOP ETF’s.
Weakness in energy continued last week following a strong run off the February lows. The question we asked in our prior update was whether the energy sector is consolidating recent gains or rolling over. There seems to have been a change in sentiment although it’s still too early to say whether the uptrend is over.
There are, however, some signs that can guide us in the short term. Different time frames are telling us different things at the moment so it’ll be important to keep a close eye on where and when price action resolves decisively in one direction.
Let’s get right to the charts.
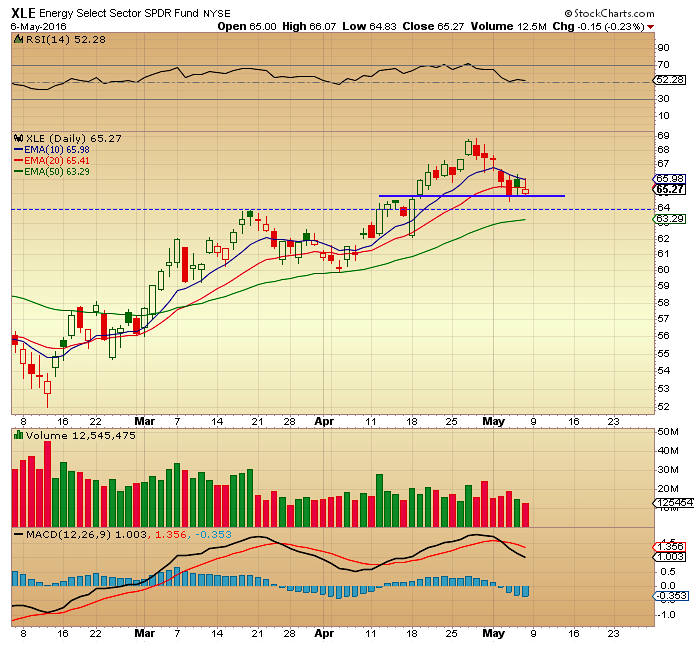
On the daily chart of the XLE, below, price action began to roll over at the end of last week and followed through this week. The 10 day ema was acting as support and, as is often the case, became resistance once it was breached on Tuesday. Despite daily attempts, the XLE was rejected at the 10day ema for the remainder of the week. Price then went on to breach the 20 day ema on Friday to close out an ugly week, which saw the ETF down 3.3%. The one bright spot is that it managed to hold horizontal support at $64.85. Further support below sits at $64 and then at $63.29 which is the 50 day ema.
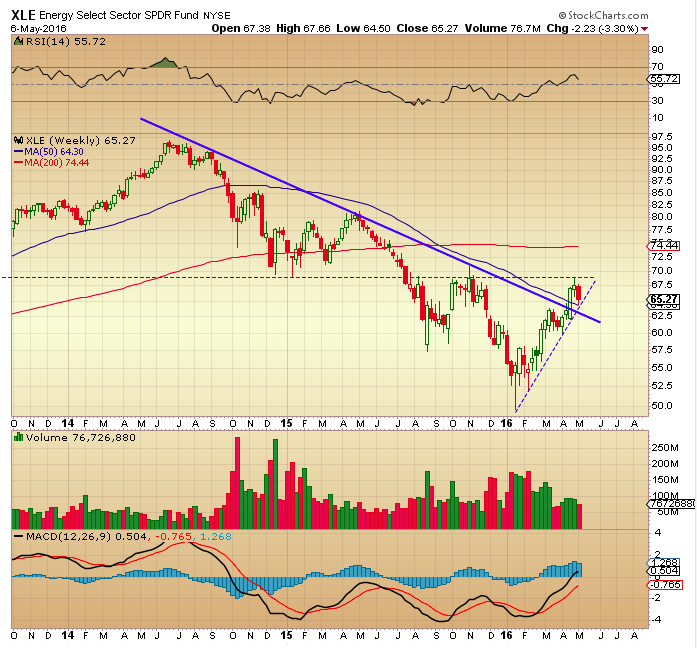
As for the weekly time frame, below, the XLE was able to hold on to the rising trend line despite the weakness in the sector. The bounce occurred right at the intersection of the rising trend line and the 50 week moving average. For now it is still within this ascending triangle. We’ll know soon if bulls have the conviction to push this back up and through the top of the triangle at $69 or whether it resolves lower and goes on to test the 2 and a half year downtrend line below.
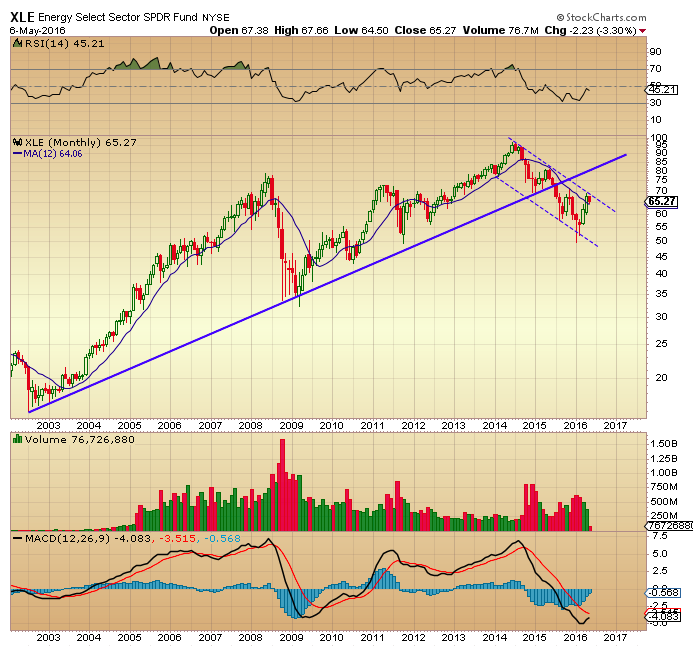
The monthly time frame, below, depicts a decidedly different picture for the Energy Sector (XLE). Here, as mentioned last week, we are still range bound within a declining channel despite the recent trend higher of the last two months. The XLE found support at the 12 month moving average but was unable to break above the upper end of the channel. Keep in mind that, ideally, we’d like MA’s pointing upwards before entering a trade with a bullish bias. The 12 month simple moving average is still reflecting the bear market that the energy sector has been experiencing since mid 2014. Although still early in the month, we still have much work to do on this time frame in order to give credence to the bull theory of a continuation of the recent uptrend.
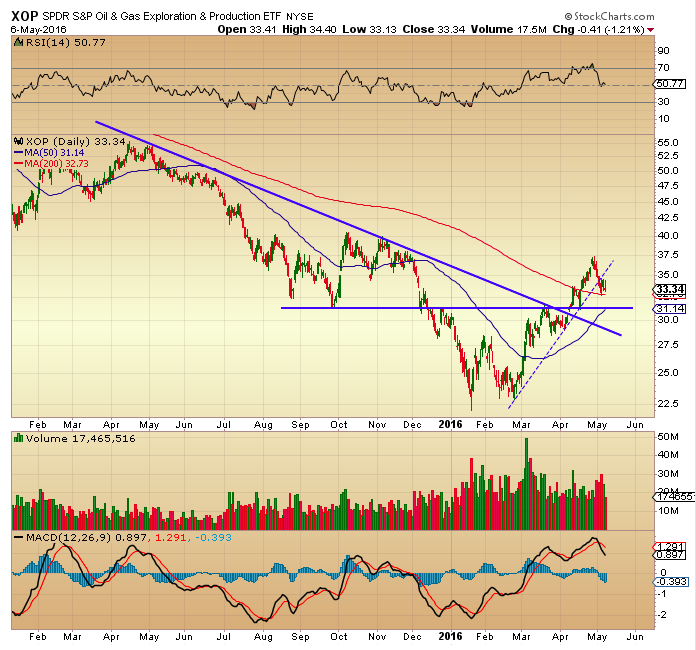
As for the XOP, Oil and Gas Exploration ETF, below, price breached its rising trend line and resolved lower on the daily time frame. We mentioned the beginning of this breakdown last week and, although it traded sideways after the break, it was not able to recover trend line. On the bright side, it did find support at the 200 day sma and went on to consolidate above it. We’ll see next week whether it attempts to reclaim the trend line or whether it continues down towards horizontal support at $31.30 which is also intersecting with the 50 day sma. Support there is strong and if it were to break that level we could see a retest of the 12 month down trend line.
So we find ourselves once again in a period of chop. The strategy here depends on your time frame but the common denominator is the uncertainty regarding the continuation of the near-term trend higher. There are signs of weakness building in the energy sector but much will depend on the continued strength of the US Dollar. The recovery of the US Dollar, if it continues, will likely weaken the energy sector further so that is something worth keeping an eye on if you are trading energy related stocks or ETF’s.
Since time frames don’t align at the moment, it’s imperative to keep an open mind as to where the energy sector is headed in the short to medium term. Although the monthly time frame on the XLE still has much to prove, the daily and weekly charts have price at potential inflection points which should resolve in one way or the other rather soon. As always, wait for confirmation.
Thanks for reading.
Twitter: @DDCapitalFund
Tumblr: DDCapitalFund
The author does not have a position in mentioned securities at the time of publication. Any opinions expressed herein are solely those of the author, and do not in any way represent the views or opinions of any other person or entity.
 Rolling Over At Key Fibonacci Level?")


