Energy commodities have taken another significant hit so far this month. Crude Oil is down 12 percent in November and Gasoline is down 9 percent. Natural Gas, on the other hand, has actually rebounded by about 2 percent.
Natural Gas is more accurately described to be in “consolidation mode” as it ranges from about $2.00 to near $2.40.
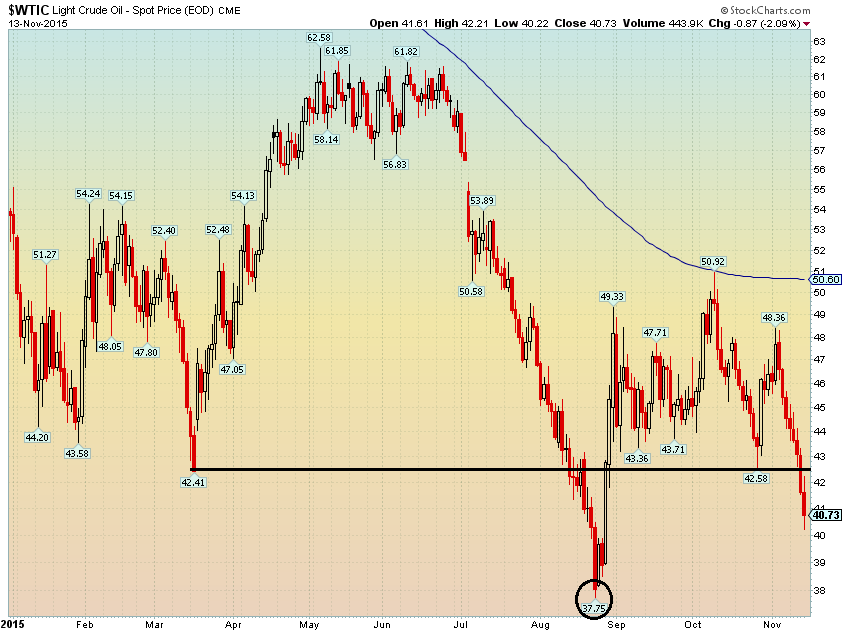
Crude oil prices broke down below the key $42.50 mark last week. This leaves the door open to a 3-handle in the very near term unless $42.50 is recaptured and held. But, it’s worth noting that the May low of $42.41 as well as the October low of $42.58 provided very little in the way of support last week.
The next price support level for Crude oil comes into play near the multi-year low of $37.75, which was tagged back in August. Bulls were hoping that the $42.50 level could hold and that the flattening 200-day moving average would at least signal a potential end to the longer-term downtrend. It was not to be.
Crude Oil Chart
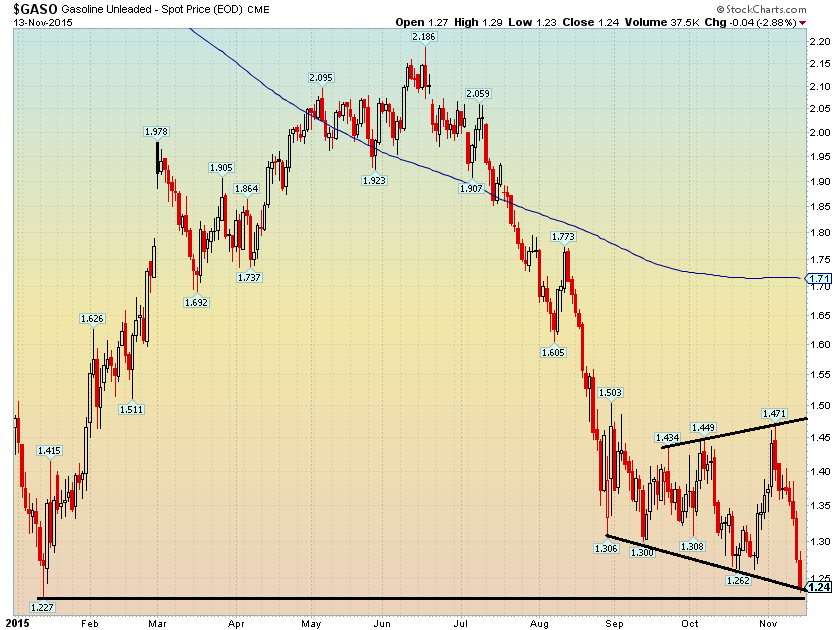
Next up on my radar in the energy space is RBOB Gasoline. Friday’s close marked a fresh 6 ½ year closing low. The multi-year intraday low comes into play at $1.227, only slightly below the current price. We may see some support at current levels based on the January 2015 inflection, as well as the downtrend support line in the below chart.
RBOB also has a flattening 200-day moving average, which indicates at least a pause in the downtrend. Resistance is found all the way up to near $1.50. Retail gas prices should come down by about 15 cents in the next few weeks should futures prices hold at these levels.
RBOB Gasoline Chart
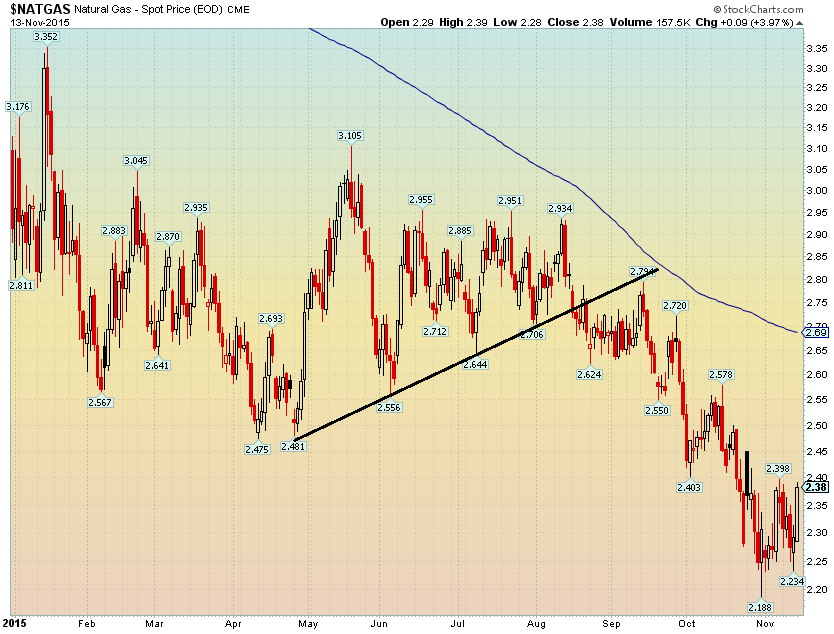
Finally, Natural Gas has had an impressive downtrend in the last year. The power-related commodity is about 85% off of its all-time high from the middle-2000’s. More recently, it spiked below $2 on the final trading day for the November 2015 contract (though not shown on the below chart).
The chart below shows an important trendline break from this past summer; NG plummeted following the August bearish breakdown. The decidedly downward-sloping 200-day moving average indicates a long-term downtrend is still in play. Traders need to be aware of the seasonal contango in effect for Natural Gas. The December contract closed the week at $2.38, however the January contract is in the mid $2.50’s. If nothing changes from now to the end of November, the prompt month price will be near $2.55 as Dec rolls off and Jan becomes the new front month. Support is at $2.19 and $1.94. Resistance is likely in the $2.50-$2.60 area do to overhead supply from the early 2015 trading range of $2.50-$3.
Natural Gas Chart
Thanks for reading!
Twitter: @MikeZaccardi
No position in any of the mentioned securities at the time of publication. Any opinions expressed herein are solely those of the author, and do not in any way represent the views or opinions of any other person or entity.


