I provided an Energy Market Roundup in mid-November in which I highlighted the price action in Crude Oil, Gasoline, and Natural Gas. You can review the November commentary here to see how some of my price levels panned out.
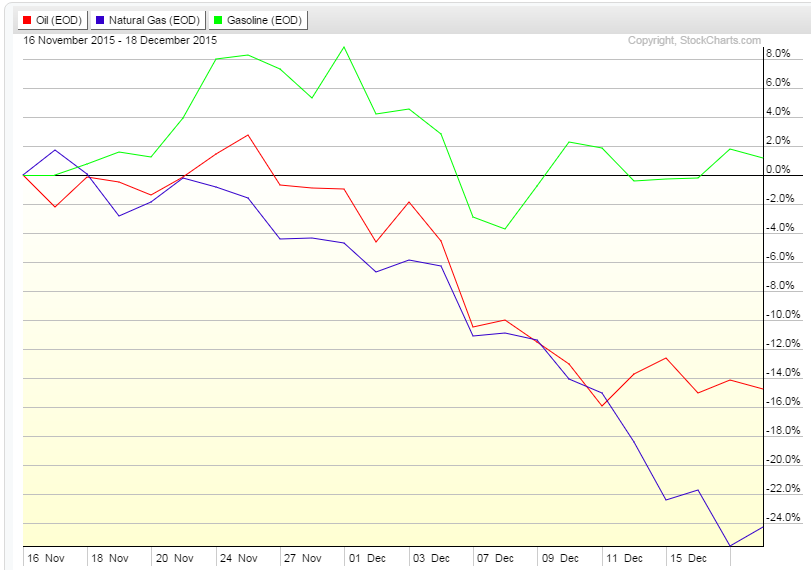
Regardless of my opinions at the time, a lot has happened in the energy market. A Crude Oil bottom continued to be elusive as prices continued there move sharply lower. Natural Gas continued its bearish trend. Yet at the same time, Gasoline prices found support and actually rallied.
What is interesting as I review the performances of these energy commodities is how Crude Oil has essentially revisited its January 2009 lows (prior major crude oil bottom), while Gasoline futures are some 30% above its 2008-09 low, much to the chagrin of drivers everywhere! More recently, WTI Crude Oil is down about 15%, Gasoline is fractionally positive, and Natural Gas has declined another 24% since the prior update.
The biggest question for many energy market traders now is how far off is a crude oil bottom? Well let’s look at the charts to see what the setup looks like.
For that, I had some help from social media.
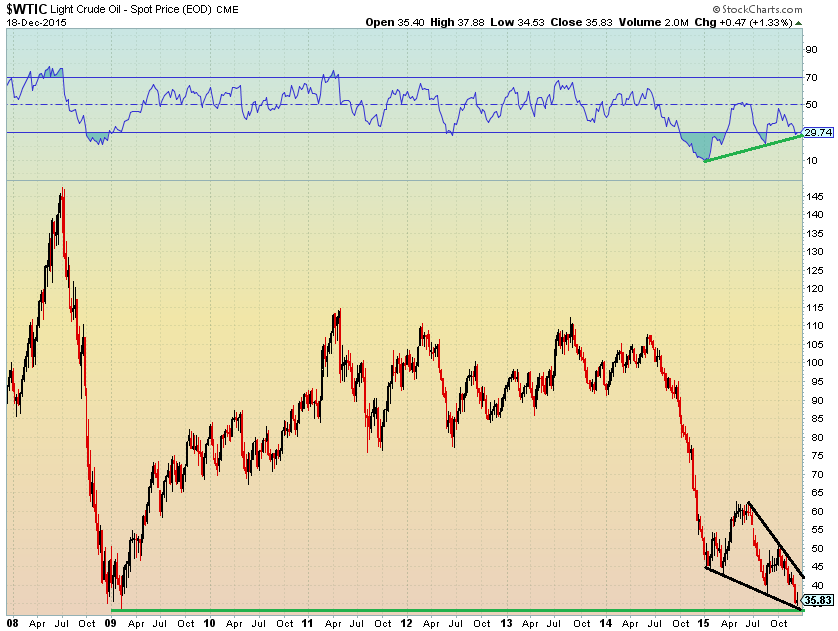
StockTwits posted the below chart yesterday from the work of Jesse Stine (@insiderBuySS). All credit is due Jesse’s way for pointing this one out. As a Chartered Market Technician, I thought I would provide some color on the chart for the readers. It is really a great example of a chart you might see on a CMT exam asking you to identify interesting technical patterns.
The horizontal green line at the bottom of the chart shows the January 2009 crude oil bottom at $33.20. For what it’s worth, the 2009 lows should provide psychological support. Also, a bullish descending wedge pattern has been forming throughout 2015. A ‘buy’ signal is triggered if price breaks above this bullish consolidation pattern. This would have been a bearish consolidation pattern had the wedge been ascending in nature.
Finally, the momentum indicator above the price chart is a 14-period Relative Strength Index (RSI) which simply measures recent gains and losses to determine whether price is gaining or losing strength in the direction of the trend. In this case, the momentum indicator is showing weakening bearish momentum. When price makes new lows on weaker bearish momentum, this is deemed a bullish momentum divergence and may lead to a crude oil bottom. That said, nobody knows exactly when the divergence will bear meaning (as far as time goes). Just check the chart out – the divergence has been ongoing for much of the year.
Bottom line though – kudos to Jesse for highlighting several bullish features on the chart of Crude Oil of which traders should consider.
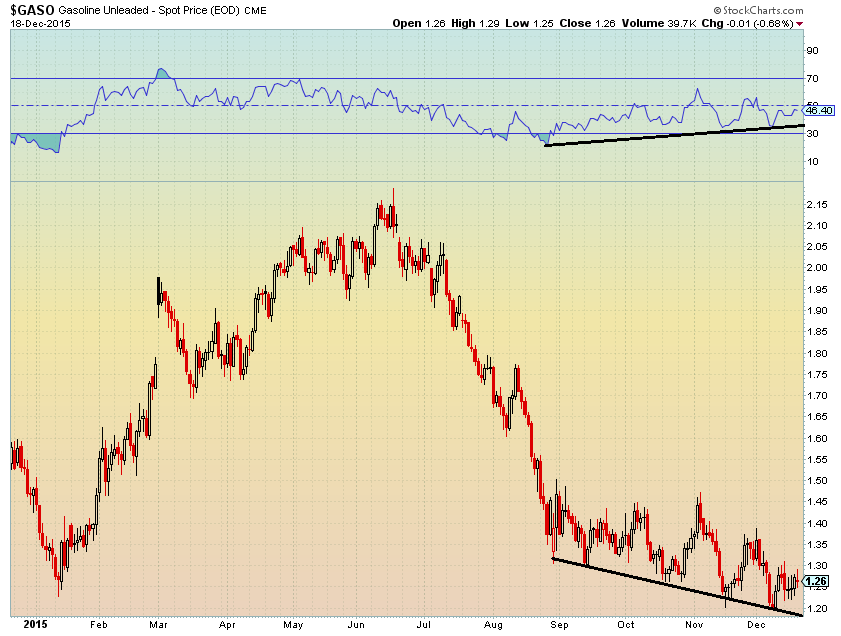
RBOB Gasoline continues to find near the $1.20 area. Its decline in the last few months has been much tamer than that of Crude Oil. To put this relative strength in perspective, Since October 20, RBOB Gasoline futures are down a modest 2% while Crude Oil futures have plummeted a whopping 28%. Not a whole lot has changed in the chart of RBOB since last month – support continues to be found at the downtrend line from the August lows. Momentum has been improving somewhat on Gasoline, so the case could be made for a bottoming process if the prompt month can climb above the $1.40 area.
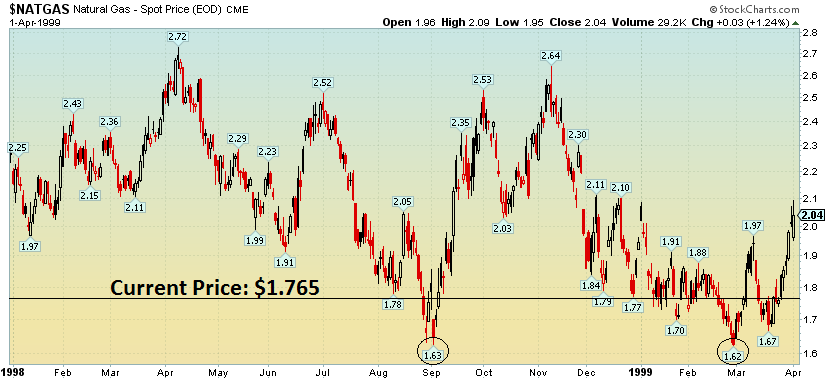
Turning to Natural Gas, it’s time to Party like it’s 1999! January Natural Gas futures have fallen to levels not seen since the Clinton Administration; dropping 19% in the past two weeks alone. This past Thursday night’s low print was $1.684 – for historical reference and possible support areas, the September 1998 low was $1.63 (EIA shows the 1998 low at $1.61) and the February 1999 low was $1.62. Prior to the 1998-1999 period, you have to go back to January 1995 to find a low of $1.25 and early 1992 when $1.04 was tagged. The last trade from Friday was $1.765.
After breaking the 2012 lows last Sunday night, NG seems to have found at least temporary support at the late 90’s lows between 1.60-1.65. Resistance is at the prior 2012 lows near 1.90-1.95, as well as spring 2015 lows between 2.40-2.50. Friday’s trading day was actually interesting – NG made a fresh 16-year low, but then rallied to finish up on the day. The chart needs to hold the 1.60’s area in order for it to gain some traction for a possible counter-trend rally. If it breaks the 1999 low, there is not much support until we get down to 1.25.
Thanks for reading!
Twitter: @MikeZaccardi
No position in any of the mentioned securities at the time of publication. Any opinions expressed herein are solely those of the author, and do not in any way represent the views or opinions of any other person or entity.


 Rolling Over At Key Fibonacci Level?")
