The Emerging Markets have been mostly hands off for investors investors for some time. Many active investors learned the hard way, hoping that a buy low, sell higher strategy would work… only to see a buy low, buy lower theme emerge. The chart of the Emerging Markets ETF (EEM) is a visual reminder of how a group can remain stuck in the mud for longer than investors think.
After a big rally in 2009 and 2010 with the broad markets, the Emerging Markets Sector ETF (EEM) has traded sideways in a broad range before falling to new lows back in January. In short, it’s traded like death.
There are many reasons for that, but two of which stand out:
1) beaten down commodities
2) a stronger U.S. Dollar
Commodities have been a lifeblood for emerging markets economies like China, Russia, Brazil, and India. So the collapse in Gold, Copper, and Crude Oil has taken its toll. The double-whammy for EM countries and companies came into play as the U.S. Dollar strengthened. A big chunk of EM debt is issued in dollars and this likely caused some pain.
BUT, the winds have changed… at least for the last two months. Commodities have rebounded, and the U.S. Dollar Index has pulled back. And, guess what: EM stocks have done quite well.
And they may have some room to run yet, depending on which country ETF or EM stock you are following.
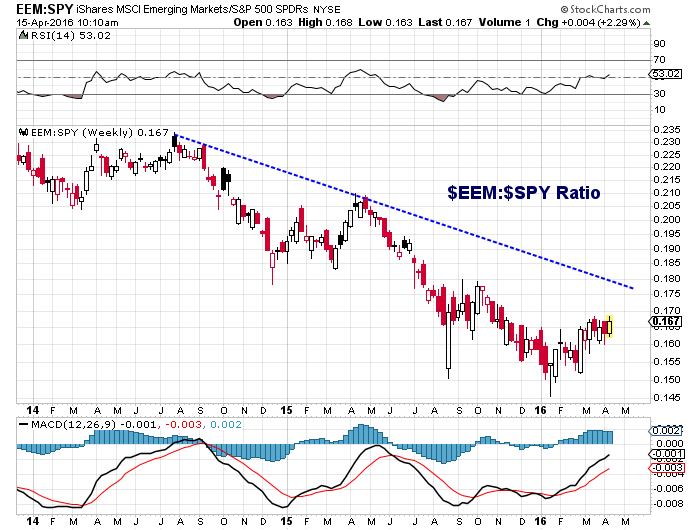
Below are 2 graphics that provide a glimpse of where the Emerging Markets (EEM) space is at. The first shows how $EEM has been outperforming the S&P 500 ETF (SPY) over the last 3 months. Mean reversion may allow for additional outperformance in days/weeks ahead.
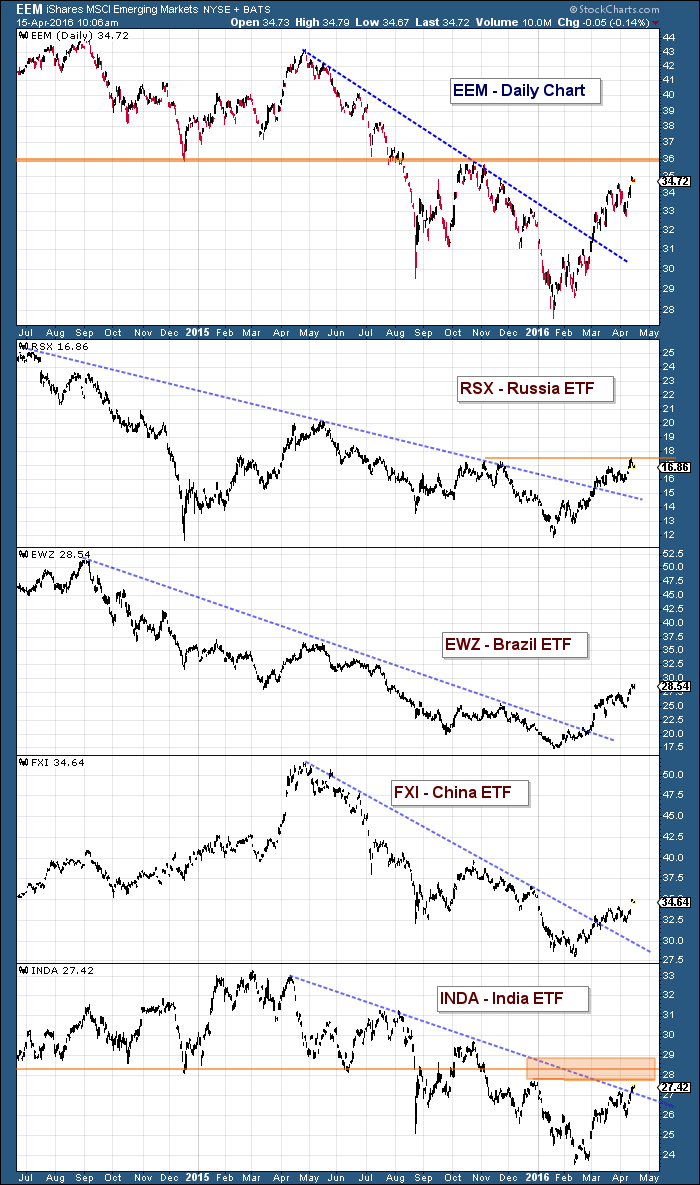
Looking across the space, you can see that most of the larger EM country ETFs have broken near-term downtrend lines. This has neutralized the selling pressure. Some are nearing prior highs (i.e. trying to put in a higher high) while others are still a ways off. EEM has resistance around $36. Russia (RSX) could head to $20 if resistance at $18 is taken out. Brazil (EWZ) and China (FXI) have a some room to push higher yet, while India is closing in on resistance.
It is important to understand, though, that the Emerging Markets are still underperforming from a longer-term perspective and unless major trends in Commodities and the U.S. Dollar take shape, the EM space may be resigned to simply a counter-trend move.
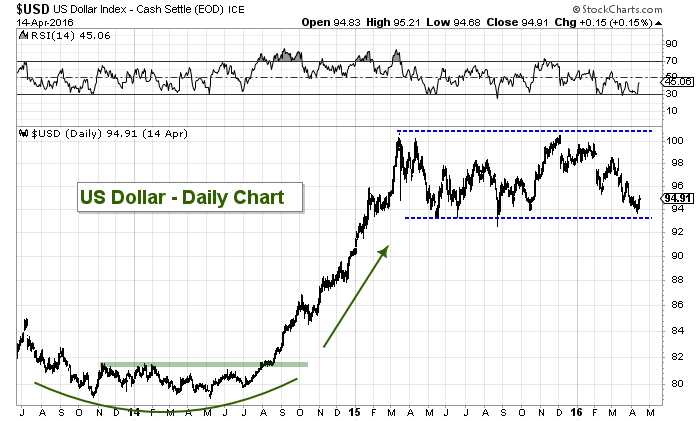
The biggest wild card and factor for me is the U.S. Dollar. It is tied in so many ways to the Emerging Markets space. Will it stay low enough, long enough to reflate the EM space (and commodities)? Under 95 on the US Dollar Index is probably bullish for this space. But should the Dollar get back over 100… the pain will return.
A Look at the buck…
Thanks for reading.
More from Andy: Market Update: The Growing Tension On The Tape
Twitter: @andrewnyquist
The author does not have a position in any mentioned securities at the time of publication. Any opinions expressed herein are solely those of the author, and do not in any way represent the views or opinions of any other person or entity.
 Rolling Over At Key Fibonacci Level?")


