 It’s no secret that Emerging Markets have underperformed Developed Markets for the past several months, as much of the capital that fueled the early stages of the Emerging Markets rally has returned to Developed Markets. So, what’s behind this trend? And how long will it last?
Taking a look from the outside in, let’s step back to the 2008 lows on the iShares MSCI Emerging Markets (EEM). One thing that sticks out is the fact that the Emerging Markets bottomed before the Developed Markets (as represented by the S&P 500). By all accounts, both markets were in free-fall mode, but Emerging Markets investors took there cue from the Federal Reserve and realized that cheap money would soon be finding its way overseas.
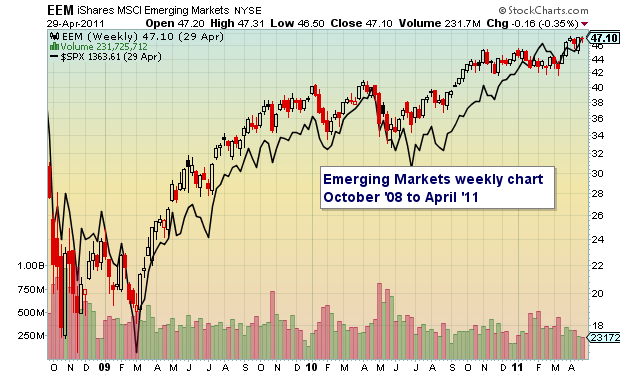
After Global Equities found there bottom in ’08/’09, Emerging Markets rallied with vigor through April 2011. Enter the European debt crisis. This hit equities across the board and caused a swift resurgence of negative sentiment (and fear) through much of 2012. By the end of 2012, global markets began to sense that the US was well ahead of the rest of the world in terms of “easing”, as another debt ceiling battle, the Sequestor, and rumors of Fed tapering began to hit the tape. Meanwhile, China was struggling and Europe would “do whatever it takes” (Draghi). In short, the kick the can as hard as we can approach worked to rotate capital out of the “fear trade” represented by Bonds and Gold, and into Developed Markets (save for the consequences down the road!).
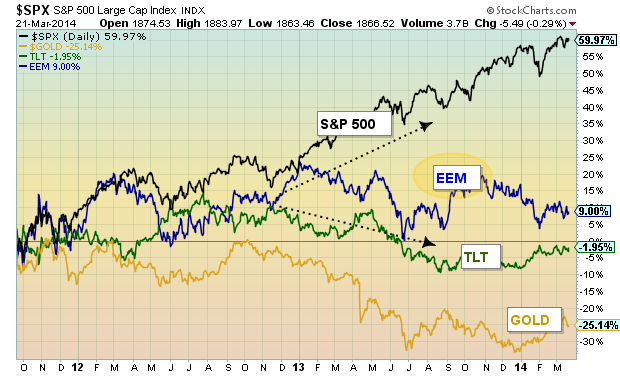
And the Great Rotation was underway. One of the losers was Emerging Markets (see chart below). As Emerging Markets began to lose appeal, capital began to flow in size towards U.S. Equities (and other Developed Markets). Truth is, the US Dollar is still the deepest, most relied upon currency in the world (again, save for that “down the road” thing).
Fast forward to today. Chinese equities are attempting to bottom (but uncertain – see chart of Copper), Russian markets are heavy (with Ukraine tensions adding to uncertainty), and global growth is still muddled. Developed Markets, on the other hand, and specifically U.S. equities, continue to carry the risk-on appeal. For more on this, read Chris Burba’s post on why Emerging Markets may not fair any better in 2014.
So, what could signal a stronger risk-on move in Emerging Markets? Perhaps a whites-of-the-eyes moment. That usually does it. Or, perhaps a rotation during the next U.S. Equities correction. But for right now, Emerging Markets and the EEM remain a swing trading instrument.
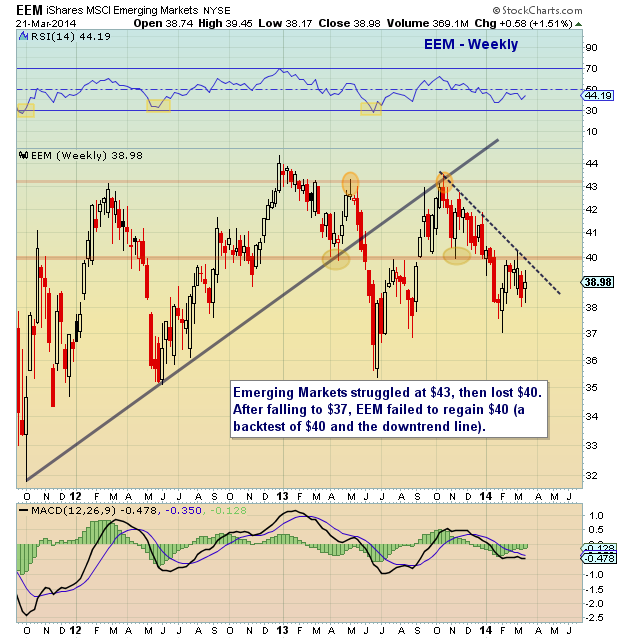
Lastly, let’s take a near-term look at EEM through a technical lens. It’s notable that each of the previous tradable bottoms came with an RSI near or below 30. Perhaps another move lower would do that. On the flip side, a sustained move through the downtrend line and $40 would end the recent malaise. Should EEM catch a bid, $43/$44 would be a likely target, but that area remains heavy resistance.
Trade safe.
No position in any of the mentioned securities at the time of publication. Any opinions expressed herein are solely those of the author, and do not in any way represent the views or opinions of any other person or entity.


")


 Ready To Break Out?")
