 By Andrew Nyquist
In my early January Emerging Markets update, I pointed out a few reasons why the Emerging Markets (EEM) may begin to lag. And more precisely, why bulls needed to see an EEM consolidation pattern emerge. For one, the index was overbought and in need of a cool down. But more importantly, the beta-friendly investing etf was beginning to lag its beta brother, the Small Caps (IWM). And just five weeks later, the global financial markets have continued to surge higher while the Emerging Markets have continued to back and fill. Market rotation anyone?
But the chart still looks good with a wider lens. So what gives? And when will the EEM consolidation pattern end? Or will it turn into deeper pullback?
These are all good questions. So let’s look at the chart for some technical risk analysis. In December the index broke out above the February 2012 highs. Although the chart formation and the action were bullish, the weekly RSI (Relative Strength Index) touched 70, its highest recording since 2010. This has spurred the much-needed EEM consolidation pattern. And, to be honest, that consolidation could easily have turned into correction had the global financial markets not continued their stampede higher. And, in that same vein, if the global markets consolidate or pullback, this could hurt the recent consolidation formation. Food for thought.
[Also Read Sheldon McIntyre’s recent work on the Emerging Markets and Copper.]
Looking at the weekly bar chart below, support 1 is the near-term uptrend line and should provide support at $42.50-$43.00. Note as well the 20-week moving average at $42.52 as well. A successful retest, followed by a move higher would be bullish and target a retest of the 2011 highs. However, if this support area fails and sustains a move through support 1, then the EEM consolidation pattern may turn into a deeper pullback, possibly targeting support 2 (the intermediate term uptrend line).
Trade safe, trade disciplined.
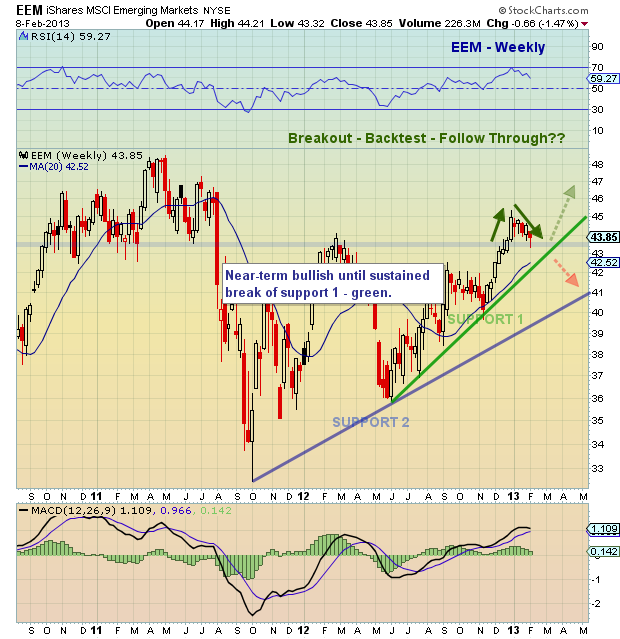
Emerging Markets EEM consolidation pattern highlighting key technical support levels.
Twitter: @andrewnyquist and @seeitmarket
No position in any of the mentioned securities at the time of publication.


 Ready To Break Out?")
 Rolling Over At Key Fibonacci Level?")

 Ready To Break Out?")
