 Our suspicion from last month that Mr. Market may fight to survive until mid-late April has been confirmed. But now, the S&P 500 (SPX) is trading below it’s intermediate (2012-present) channel. At this crucial moment, let’s take a look at where SPX has been, and run it through Elliott Wave analysis and some key planetary cycles to gauge where it may travel next.
Natural Order of Growth
Both Elliott Wave and planetary cycle theories share a common theme: they are founded on the natural order of growth, moving three steps forward and then two steps back. Both provide guidelines to help us see around the corner rather than be limited by our understanding of the immediate past. The caveat is that these are guidelines, designed to narrow the possibilities and not necessarily provide an absolute or omniscient perspective. This, I believe, is why so many throw in the towel or declare both tools useless. However, together they offer an objective and confirming perspective of our past, present and potential for the future.
Pluto-Uranus Square and the Greater Super Cycle
The Pluto-Uranus cycles during the last century coincides with the secular (decades) shift in the inflationary cycle of the ‘30s, late ‘60s and today. Back in 2004, the long-term bond market and equities decoupled. This was a warning that the danger of low inflation as in the 1930s was upon us. While we celebrated the success of the Great Moderation, collective exuberance once again reared its ugly head as we ignored the risks to our banking industry with excessively low interest rates. What followed was the subprime banking crisis that began in the U.S. and spread throughout the developed world. However, the first meeting of Pluto-Uranus in the summer of 2012 signaled the peak of the long-term bond market (return of inflation) and months later at the New Year, the Great Rotation from bonds to equities was underway.
The intermediate channel (in green, below) from which S&P 500 has broken down highlights this period to the present. In terms of Elliott Wave, we appear to be at the end of the fifth Intermediate Wave in this channel (in green), and at the end of the third Primary Wave (in red) that began in 2009.
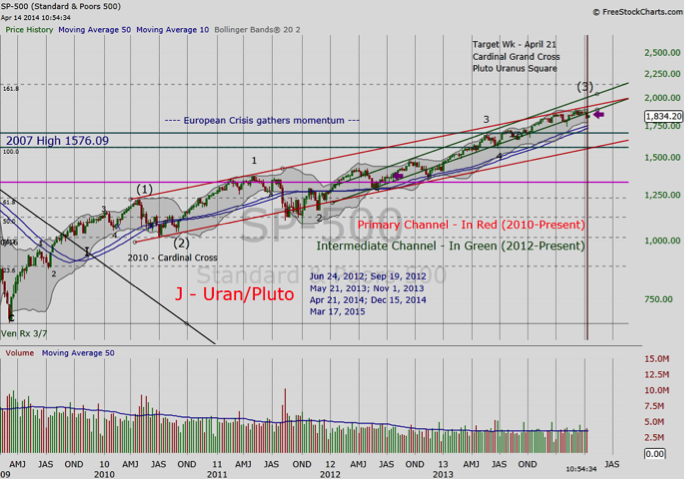
Figure 1 Weekly Chart of SPX 2009-Present
Grand Cross and Pluto-Uranus Square (Elliott Wave – Primary Wave 3)
Primary Wave 2 found support around the first cardinal cross in the summer of 2010. The players involved then were Jupiter and Uranus in Aries, Pluto in Capricorn, and Saturn and Mars in Libra. From an economic perspective, China had topped and the banking crisis in the U.S. had spread to Europe.
The Grand Cross and the next Pluto-Uranus square meet up later this month on April 21, 2014. In last month’s discussion of Elliott Wave we wondered whether the market might just continue to truck along until this date.
Now we are trading below the intermediate channel and the 10/50 week moving average. The bulls are fighting to stay alive. As shown in figure 1, we are also near the top of the primary channel in red and nearing the next cardinal cross and Pluto-Uranus square. The message of both Elliott Wave and planetary patterns indicates we are nearing the end of a major period.
Looking Ahead – What Can We Expect From Elliott Wave – Primary 4
Provided our Elliott Wave count is correct, Primary Wave 4 can be expected to find support near the base of Intermediate Wave 4. Figure 2 is the daily chart of the SPX, offering a bird’s eye view of potential support levels as the correction plays out.
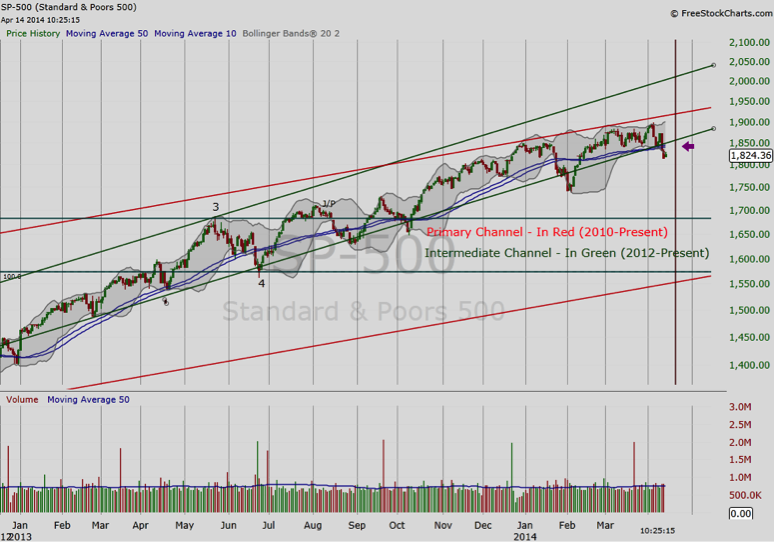
Figure 2 Daily Chart of the SPX 2013-Present
Wave 4 and Beyond (China and Oil Paradox)
Corrections are opportune times to look for clues regarding the market’s future potential. As we shared in our Wage Growth and Retail Indusry study last week, wages are an important indicator of consumer spending power and its impact on retail sales and GDP; particularly because Retail commerce makes up about 70% of our economy.
Later this month, Q1 2014 wage growth figures are released. Strong numbers, and more importantly, growth that can outstrip energy costs is important for setting expectations about the trajectory (or lack thereof) for Primary Wave 5. As shared in our study of the Oil Paradox, oil up equals demand until outsized input costs leads to decline.
China is a major factor here. The Oil Paradox will likely play an important factor now that China is showing signs that it may finally be waking up. Today, the Shanghai SE Composite Index (SSEC-X) is trading in a tight range, an indication that it is time to begin watching for potential developments for the second largest economy. No doubt, this is a time to note the price activity for industries that will benefit if/when this giant wakes up.
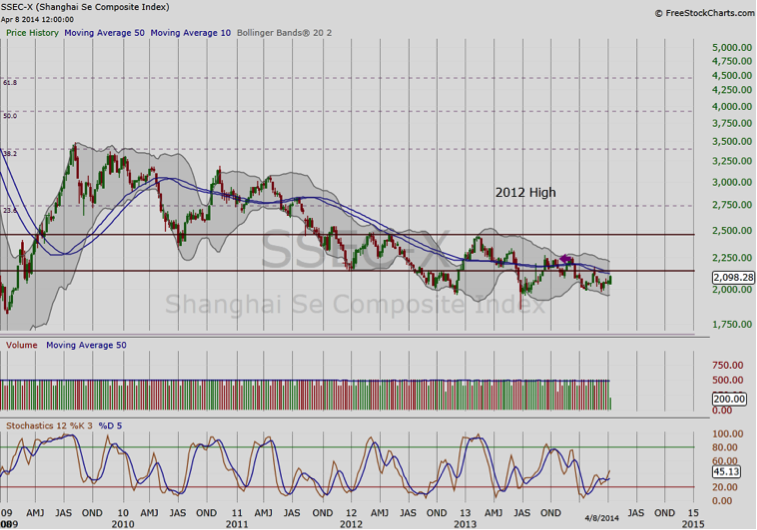
Figure 3 Weekly Chart of SSEC-X 2009 to Present
However, a pickup in Chinese economic activity will coincide with rising energy costs rising, which could add further burden to the consumer if wage growth cannot outstrip the cost of consumption. Whether the two can or cannot reconcile is an important dynamic and that will play a major role in how Primary Waves 4 and 5 play out.
Until next time, thank you for reading.
Author holds no positions in securities mentioned at the time of publication. Any opinions expressed herein are solely those of the author, and do not in any way represent the views or opinions of any other person or entity.


