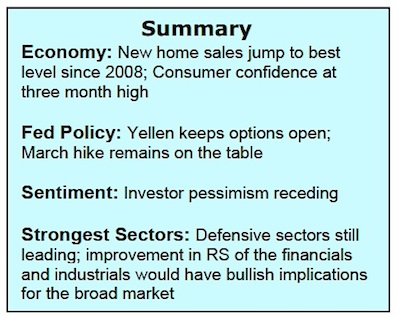
The equity markets rose for the second week in a row last week with most of the gains occurring last Friday following the Bank of Japan’s (BOJ) decision to take interest rates negative. A 10% rally in crude oil prices also played a significant role in supporting stocks move off the lows. Since the start of the year, there has been a 97% correlation between oil and equity prices.
The stock market also benefited from fourth-quarter earnings as 77% of the companies with the S&P 500 beat forecast. The two-week stock market rally cut the losses for the month in the popular averages nearly in half. This increases the likelihood that the intraday low of 1810 on the S&P 500 Index and 15666 using the Dow represent the lows for the cycle.
We are also encouraged by the fact that the upside volume on Friday overwhelmed the downside volume in stocks by a ratio of 11-to-1. This suggests that the downside momentum experienced since the start of the year has been broken, which could lead to further gains. Support for the S&P 500 is at 1860 with resistance in the 1970 to 2000 range.
Near term, the weight of the technical evidence increases the probability that stocks could soon test the upside resistance zone of 1970 to 2000 on the S&P 500. Despite the stock market rally in the second half of the month, stocks remain oversold and underbelieved. Less than 20% of NYSE issues are trading above their 10- and 30-week moving averages. Although this is indicative of a breakdown of the trend, it also suggests stocks are deeply oversold and could be enough to refuel another leg of this stock market rally off the lows.
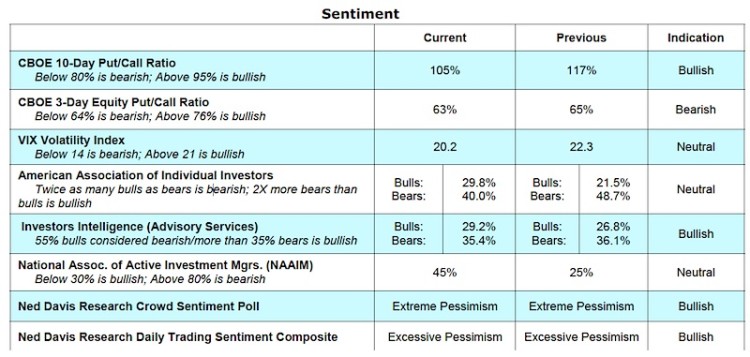
Investor sentiment remains cautious as seen in the latest reports from the American Association of Individual Investors (AAII) and as seen in Investors Intelligence (II) that continues to show more bears than bulls. We are also encouraged by data from the Chicago Board of Options Exchange (CBOE) that shows that there remains a strong appetite for put options (buyers of put options expect stock prices to go lower). The CBOE Volatility Index (VIX), despite the second-half January rally, remains elevated closing on Friday at 20 (readings below 14 are considered bearish).
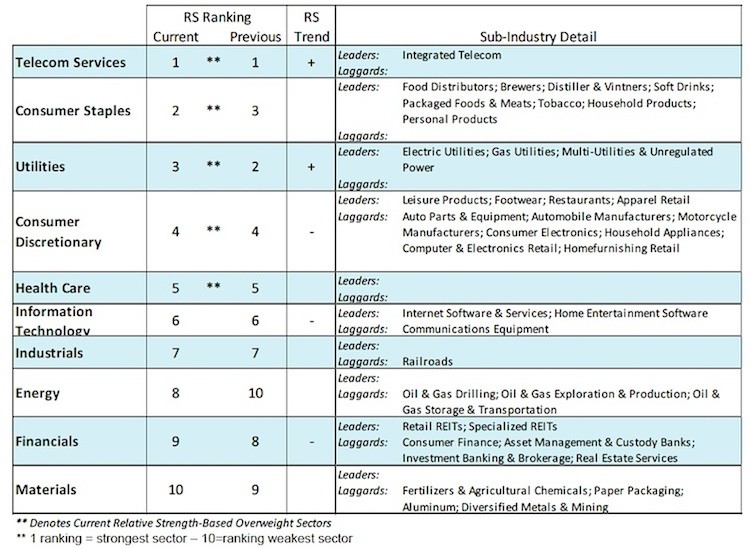
Looking further out, the performance by the broad stock market over the next few weeks remains the key to the sustainability of the current advance. The interruption of the downside momentum last week was a necessary first step. This should be followed a broadening out of the rally that eventually includes most groups and sectors. Currently only 13% of the 100 industry groups within the S&P 500 are in uptrends. In order to gain confidence that the long-term bullish trend of the stock market has been restored 50% or more groups are required to be trading in a defined uptrend.
This post was written with Bruce Bittles, Chief Investment Strategist at Robert W. Baird & Co.
Twitter: @WillieDelwiche
Any opinions expressed herein are solely those of the author, and do not in any way represent the views or opinions of any other person or entity.


