Unless you live in a cave, you are likely aware that stock markets around the world have been in a downtrend for the past few months. And many investors are concerned about the status of the bull market. Below is a chart that looks at the Dow Jones Industrial Average (DJIA) dating all the way back to the 1926.
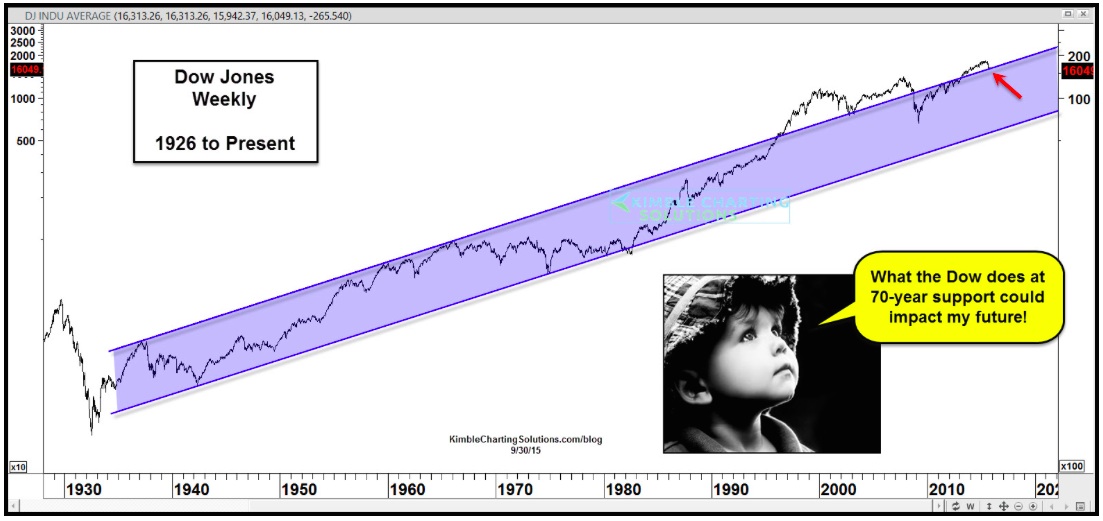
The Dow Jones Industrial Average has spent a majority of the past 90 years inside of this rising channel. It broke above the channel in the late 1990’s and saw the upper channel line become support during the 2002-2003 lows. But it’s worth noting that during the 2007-2008 time frame, once the rising channel support broke, the Dow Jones declined for several months.
Well, once again we’ve seen the bull market push the Dow Jones back above the upper channel line only to see a deep correction test the support line again.
This week, Carl Icahn expressed his concerns that the stock market could fall further into a bear market. You can read about Carl’s concerns here.
My take on this is that support is support until it’s broken. And the Dow Jones is still holding above this support line.
Should this support fail to hold, the little boys comments above, say it all! Thanks for reading and have a great weekend.
Twitter: @KimbleCharting
Any opinions expressed herein are solely those of the author, and do not in any way represent the views or opinions of any other person or entity.


