 Back in early April, the Bank of Japan under newly-appointed Governor Kuroda announced policy measures to inject $1.4 Trillion (almost 135 Trillion Yen) into the Japanese economy over the ensuing 20 months. This Abenomics-prescribed “unprecedented stimulus” (actually modest in comparison to the Federal Reserve’s annualized $1.02 Trillion in asset purchases) unveiled then was intended to ramp inflation to 2% by the end of 2014, doubling Japan’s monetary base.
The news, widely and eagerly anticipated, was nevertheless met with a fit of manic buying: Japan’s benchmark Nikkei 225 stock index (NKY; futures: NKD) rising 29.5% over the next 37 trading sessions (only 9 trading days during this run closed down, and only 4 of those greater than -1%) before topping out on May 22 with a closing high at 15695 (check out Sheldon McIntyre’s perfectly-timed post from that day right here). A 10 session, -16.6% Nikkei correction followed, at its worst retracing all but 30 points of April-May’s 3575 point rally to a low of 12310 on June 6th.
Over the following 6 months, the Nikkei has steadily clawed it’s way back toward its late-May high watermark, even installing a new closing year-to-date high at 15760 on December 2. During this period, the index has experience major, but progressively dampened (much like the S&P 500) volatility with sequentially smaller pullbacks of -16.6%, -12.4%, -7.7%; and lastly -5.4% in late October.
Each of these pullbacks (the last being a partial exception) has borne a very similar technical signature:
- A sharp move higher that break the upper Bollinger Band on successive days, followed by
- Short moderation in the angle of advance, leading to a local high; and then,
- A swift decline, breaking the lower Bollinger Band at its nadir before consolidating.
Additionally, the %B (a measure of price’s orientation v. its Bollinger Bands) over the duration of step 2 has produced a classic negative momentum divergence in each case.
Here’s the repetition of this progression since the BoJ’s announcement on April 4th:
Nikkei 225 (NKD) – Daily: Bollinger Studies Signal Each Year-to-Date Nikkei Correction
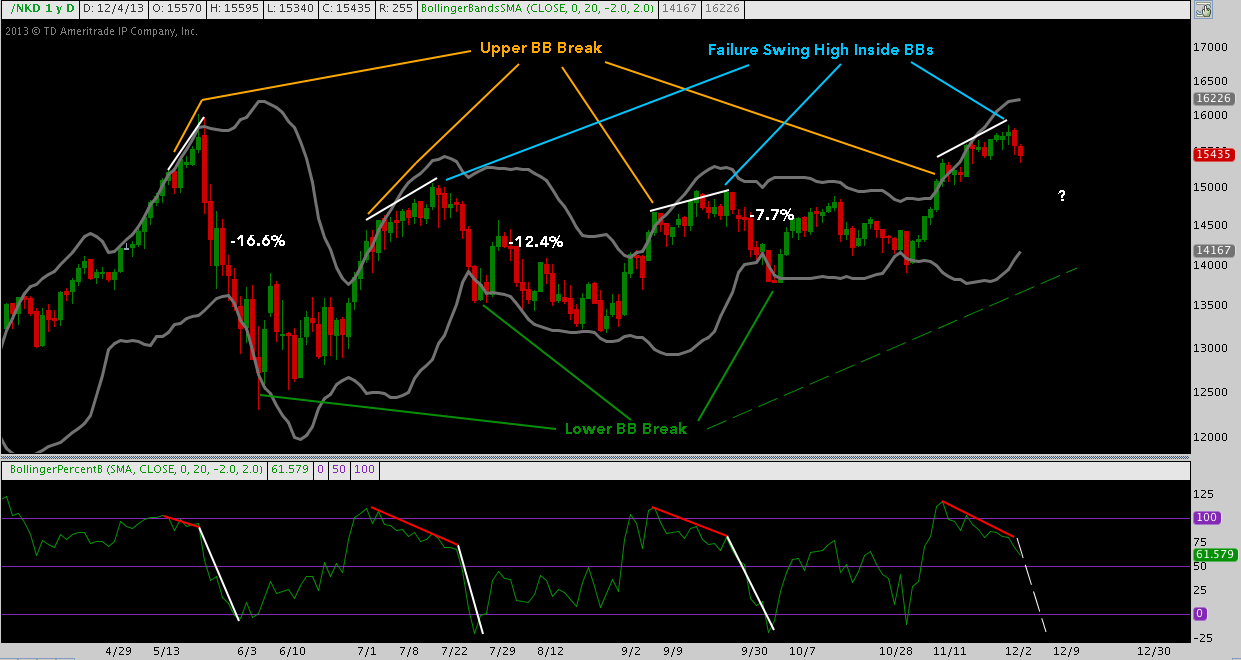
Of the 4 pullbacks shown, NKD shows a striking similarity to -12.4% and -7.7%. Each move begins with an acutely ascending jump off the lows in large-ranging positive days until the upper BB snaps once or twice. Price then downshifts into a moderated, grinding move higher: the -12.4% correction moved higher for 9 sessions following the upper BB break before topping; the -7.7% pullback moved higher for 12. After this, NKD rolls and deals most of the damage in a swift multi-session drop.
The %B signals (in red) given here should be taken with a grain of salt: slackening momentum only means an instrument is slowing down – whether it will then reverse is an entirely different concern. Still, the Nikkei ably demonstrates what these momentum divergences can do, and are giving every indication of doing again. Taking the -12.4% and -7.7% pullback ranges into consideration and given the positioning of the lower Bollinger Band – a reliable downside attractor in 2013 – a peak-to-trough Nikkei correction that retests October’s low near 14000 is a plausible outcome.
Twitter: @andrewunknown and @seeitmarket
Author holds no exposure to securities mentioned at the time of publication.
Any opinions expressed herein are solely those of the author, and do not in any way represent the views or opinions of any other person or entity.


