With the Greece negotiations lurching toward a conclusion, the next few days may provide a key insight into the market’s next big move. Here we present the technical case for our main bearish scenario for the German DAX stock market as well as an alternate bullish one.
On a weekly chart, the DAX has recognized the boundaries and harmonics of a channel stretching back to 2012. With that as a guide, we designate the October 2014 low as a fourth wave, because it represented the greatest downward excursion out of the main channel and because price found support at the 50% harmonic of the channel. (Other major stock market indices put in similar patterns at the same time.)
A weekly line-on-close chart makes the German DAX channel easier to see. The channel is anchored at the ends of waves [i], [ii] and [iii].
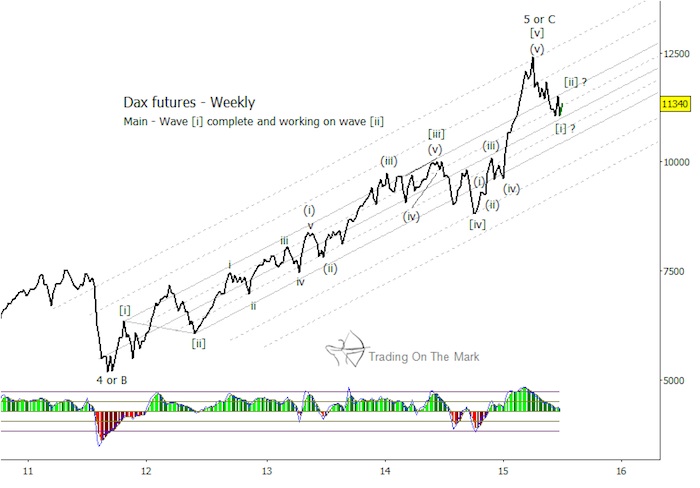
The rally out of the October 2014 low was more clearly impulsive in the German DAX than in counterpart indices. It had a five wave structure with an extended fifth wave, and it stopped at an important harmonic of the channel. In addition, the rally put the DAX over our primary targets on a monthly chart (not shown). The possibility of a completed upward pattern made the April high in the DAX a candidate for the top. The next step for traders has been to watch for confirmation.
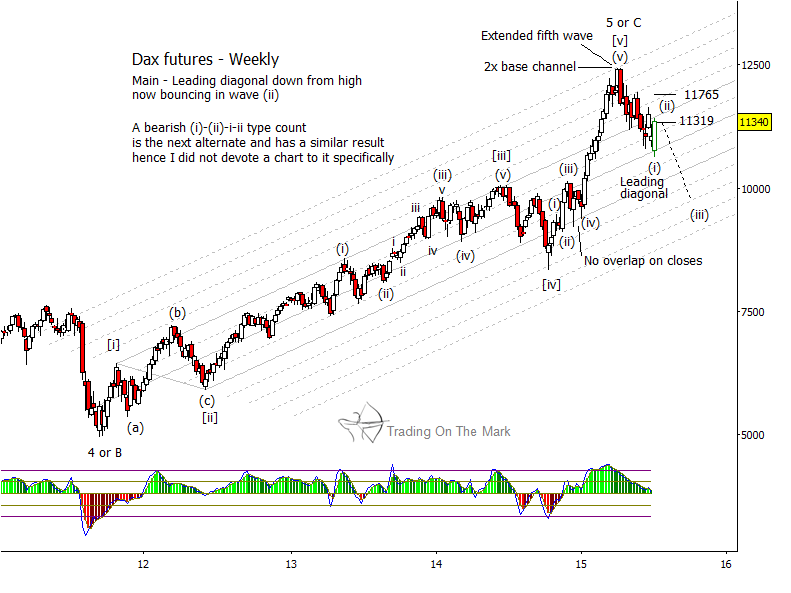
The forceful downward move after the April high fits the structure of a leading diagonal pattern on lower time frames, which means it could be the initial move in a downward reversal. For equity indices and some other financial issues, the occurrence of a leading diagonal in an area after a candidate top or bottom often produces a weak retrace followed by a strong continuation move. In the present case, the German DAX has slightly exceeded a Fibonacci 38.2% upward retrace at 11,319 in response to the possibility of progress in the Greek negotiations. Additional areas to watch as possible resistance include the main upper boundary of the channel, which will be at approximately 11,660 next week, and the Fibonacci 61.8% retrace level near 11,765.
If the German DAX turns downward next week, then the initial areas to watch as targets for wave (iii) include the lower main boundary and the lower 50% harmonic of the channel (approximately 10,550 and 9,980 respectively). Continued downward pressure probably would lead to a later test of the 100% channel harmonic and possibly the price level of the October 2014 low at 8,350. Additional confirmation of a trend change would come if the adaptive CCI indicator breaks beneath its zero line.
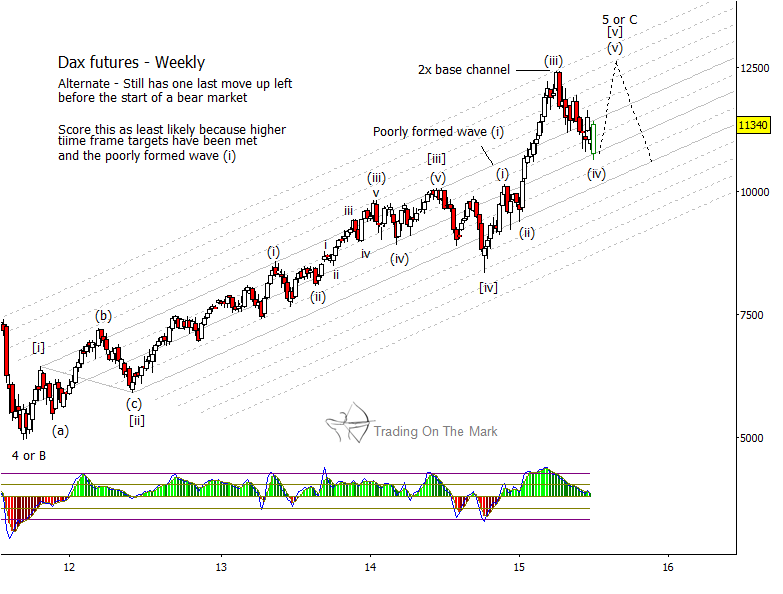
On the other hand, if the center line of the channel holds after having been tested this week, then traders might consider the alternate scenario of one more marginally higher in the DAX, as shown on the chart below. At this point, we believe the bullish scenario is unlikely, but we cannot yet rule it out.
Would you like to get timely notifications of trading opportunities? Let us know if you’d like us to send you some examples of our subscriber-only posts. For readers who contact us this weekend, we’ll also send updated charts of the S&P 500, which is displaying a different and potentially bearish pattern.
Thanks for reading.
Twitter: @TradingOnMark
No position in any of the mentioned securities at the time of publication. Any opinions expressed herein are solely those of the author, and do not in any way represent the views or opinions of any other person or entity.

 Rolling Over At Key Fibonacci Level?")


 Rolling Over At Key Fibonacci Level?")