 S&P Futures (Symbol: ES) are modestly chiseling away at their tenth consecutive day higher on this President’s Day, an event that has occurred only 2 times in the last 20 years (with both occurring in the last 5):
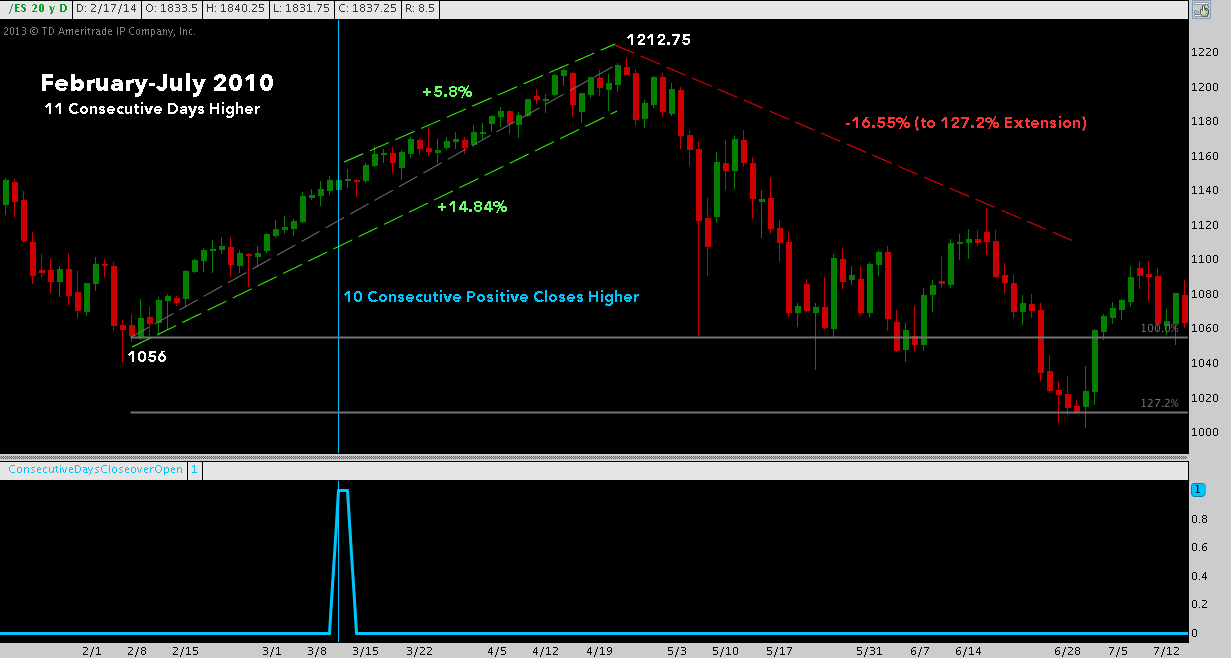
- 11 consecutive days in March 2010, amidst a run of 35-of-50 up days that added +14.84%; and
- 10 consecutive days in July 2013, inside a run of 23-of-28 up days that added +8.76%.
ES – February-July 2010: 11 Consecutive Days Higher (click image to zoom)
ES – June-August 2013: 10 Consecutive Days Higher (click image to zoom)
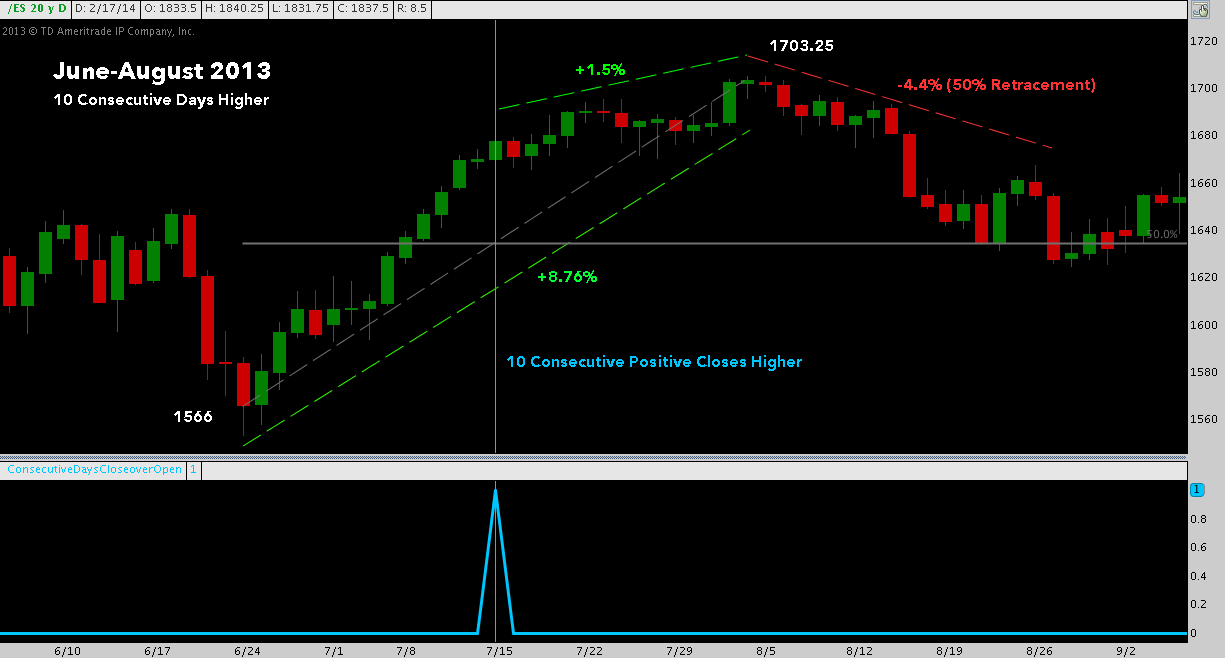
These runs ended with ES pulling back to below the close of the tenth consecutive day higher, giving back -16.55% and 4.4%, respectively. Before it rolled over, though, ES added +5.8% after that tenth consecutive day in the first case; and in the second, ES ran another 1.5%.
The current run is shorter and comparatively swift, adding +5.84% from 02/03/14’s closing 1736.50 low to the present. How could it end? A leading scenario: A Bearish Shark harmonic pattern unfolding here suggests a potential reversal zone +1.03%-1.79% higher, ending the current run at +6.87%-7.63%.
ES – January-February 2014: 10 Consecutive Days Higher with Bearish Shark
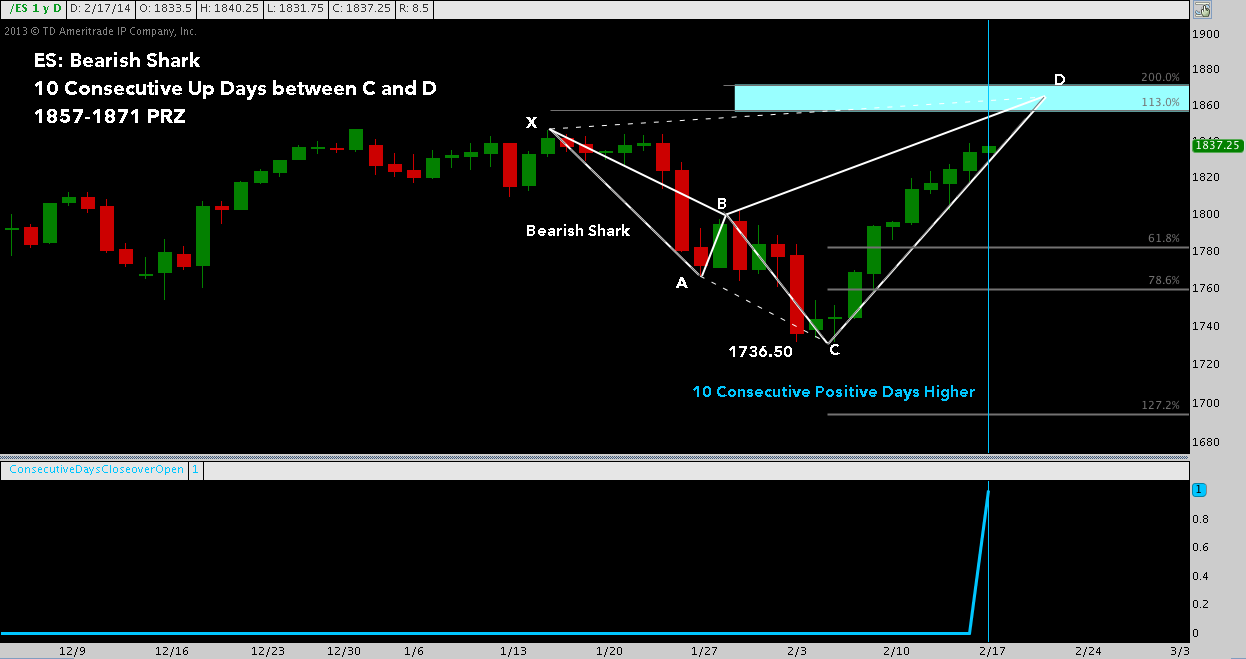
Primary downside objectives off the Shark come in at B (the 50% retracement from the PRZ to C, like in mid-2013) at 1797 – where it may turn into a Bullish 5-0 pattern – and the 61.8% retracement at 1781. A move similar to 2010’s sell off goes to the 127.2% extension near 1695.As with any pattern, flexibility is the key to successful risk management and avoiding the forfeiture of a great trade in favor of a merely good one: these are tentative objectives, not presumed bounce points and it goes without saying that follow through from this pattern could always devolve into a more substantial correction.
Twitter: @andrewunknown and @seeitmarket
Author holds no exposure to instruments mentioned at the time of publication. Commentary provided is for educational purposes only and in no way constitutes trading or investment advice.
Any opinions expressed herein are solely those of the author, and do not in any way represent the views or opinions of any other person or entity.
 Ready To Break Out?")


 Rolling Over At Key Fibonacci Level?")
")

