 In mid-January, I wrote a post about Corn prices nearing important technical support. As with all my chartology posts, I try to cover levels that mean something. At the time, Corn prices were beaten down but nearing the .618 Fibonacci retracement level of the entire bull market run from 2000 to 2012. That’s pretty important.
Although this doesn’t guarantee a long-lasting rally, it does tend to offer good risk/reward. In that post, I wrote:
…corn prices have landed near the .618 Fibonacci retracement level. This could work to usher in higher prices over the near-term. Or at a minimum provide lower support for a sideways price channel.
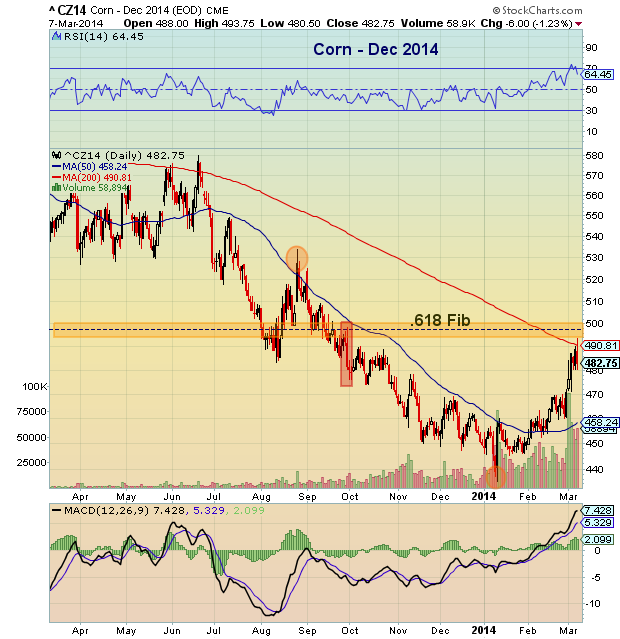
Needless to say, Corn has put together a strong rally… so strong, that it is now nearing a band of technical resistance. How Corn prices react around this level will be key.
That said, let’s look at the daily chart for December Corn. Well, it’s back again… the .618 Fibonacci retracement of the August to January decline is hanging overhead. This level also coincides with the late September breakdown.
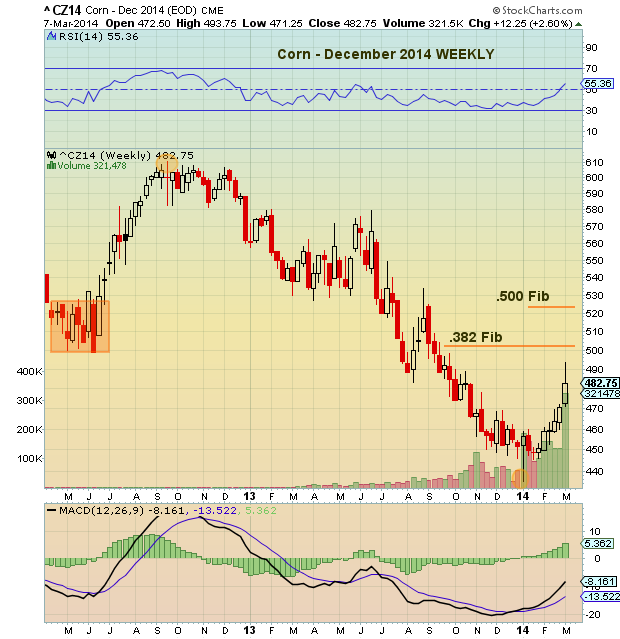
On the weekly chart for December Corn, we also see that another Fibonacci level resides just overhead (the .382 retracement of the 2012 highs to recent lows). This resistance level is just above 5.00, making the 5.00 band (give or take 0.05) important to watch. A quick thrust higher could see 5.25.
Note the nice rounded bottom here. This technical formation tends to bode well over the near-term… but this, of course, will depend on how well Corn prices can consolidate gains when this rally leg ends. Trade safe.
No positions in any mentioned securities at the time of publication. Any opinions expressed herein are solely those of the author, and do not in any way represent the views or opinions of any other person or entity.

")


