Quick chart update on Crude Oil. As most investors are aware, Crude Oil has been dripping lower for the better part of the past two months. However, prices firmed up right on cue last week… near the 16 month uptrend line. This price level was originally highlighted in my October 15 post, and again in my recent update (as well as Andrew Kassen’s recent post on secular implications).
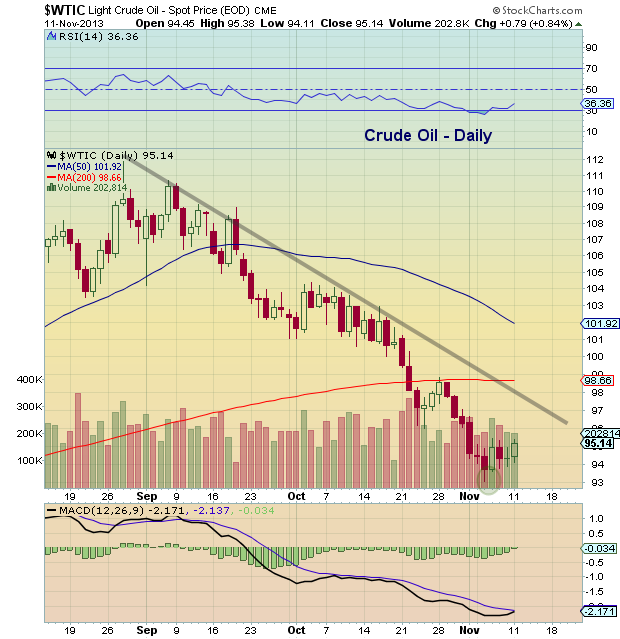
Before we look at the macro picture via some weekly charts, let’s take a quick peek at the daily chart. Although Crude Oil is setting the stage for a tradable bounce, it is still trading below its recent downtrend line, as well as its 50 and 200 day moving averages. So, these levels will need to be monitored as Crude Oil tries to get up off the mat. And, as pointed out above (and in the weekly charts below), the 16 month uptrend line around $92-$93 will be key.
Crude Oil – Daily Chart
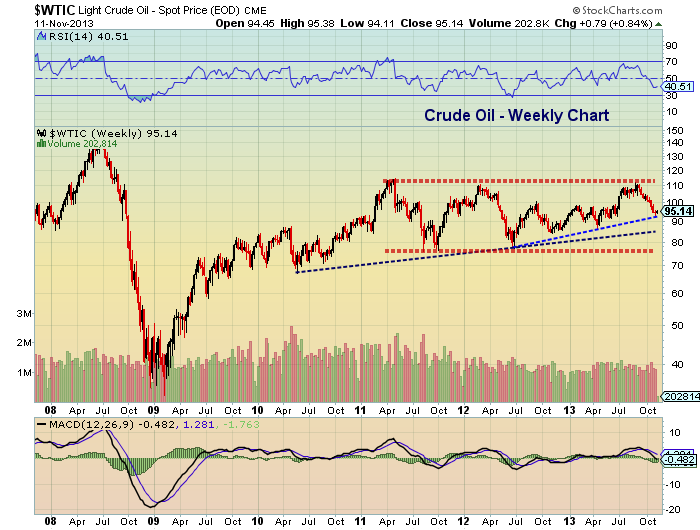
Looking at the weekly chart, Crude Oil is on bar 9 of a weekly DeMark buy setup. So the longer Crude can hold above $92, the more likely a bounce will gain traction. Should $92 break down, look for $86 to be the next level of support.
Crude Oil – Weekly Chart
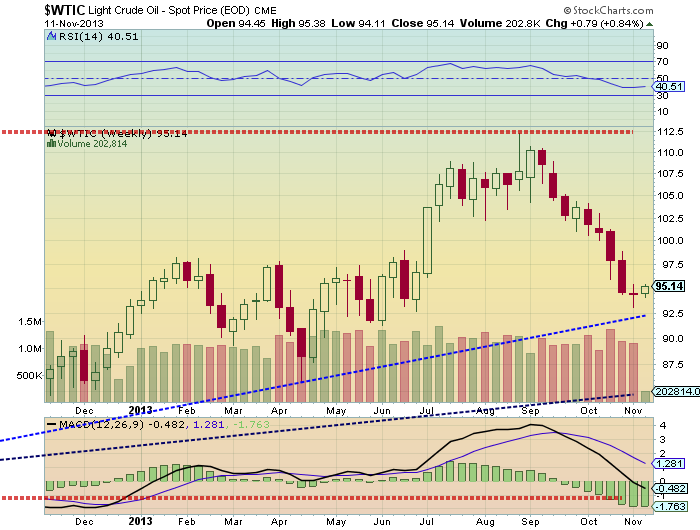
Crude Oil – Weekly “ZOOM” Chart
Trade safe, trade disciplined.
Twitter: @andrewnyquist
No position in any of the mentioned securities at the time of publication. Any opinions expressed herein are solely those of the author, and do not in any way represent the views or opinions of any other person or entity.
 Ready To Break Out?")


")

