It seems to me that the crude oil rush of 2016 is nearing an end… for now. An perhaps for the rest of 2016. We shall see – it depends on a key yearly pivot level.
As many of you are likely aware, the oil rush in 2016 has seen oil prices rally from $26 to almost $48 in under 3 months. Let’s look at some yearly pivots across the sector to see what’s next.
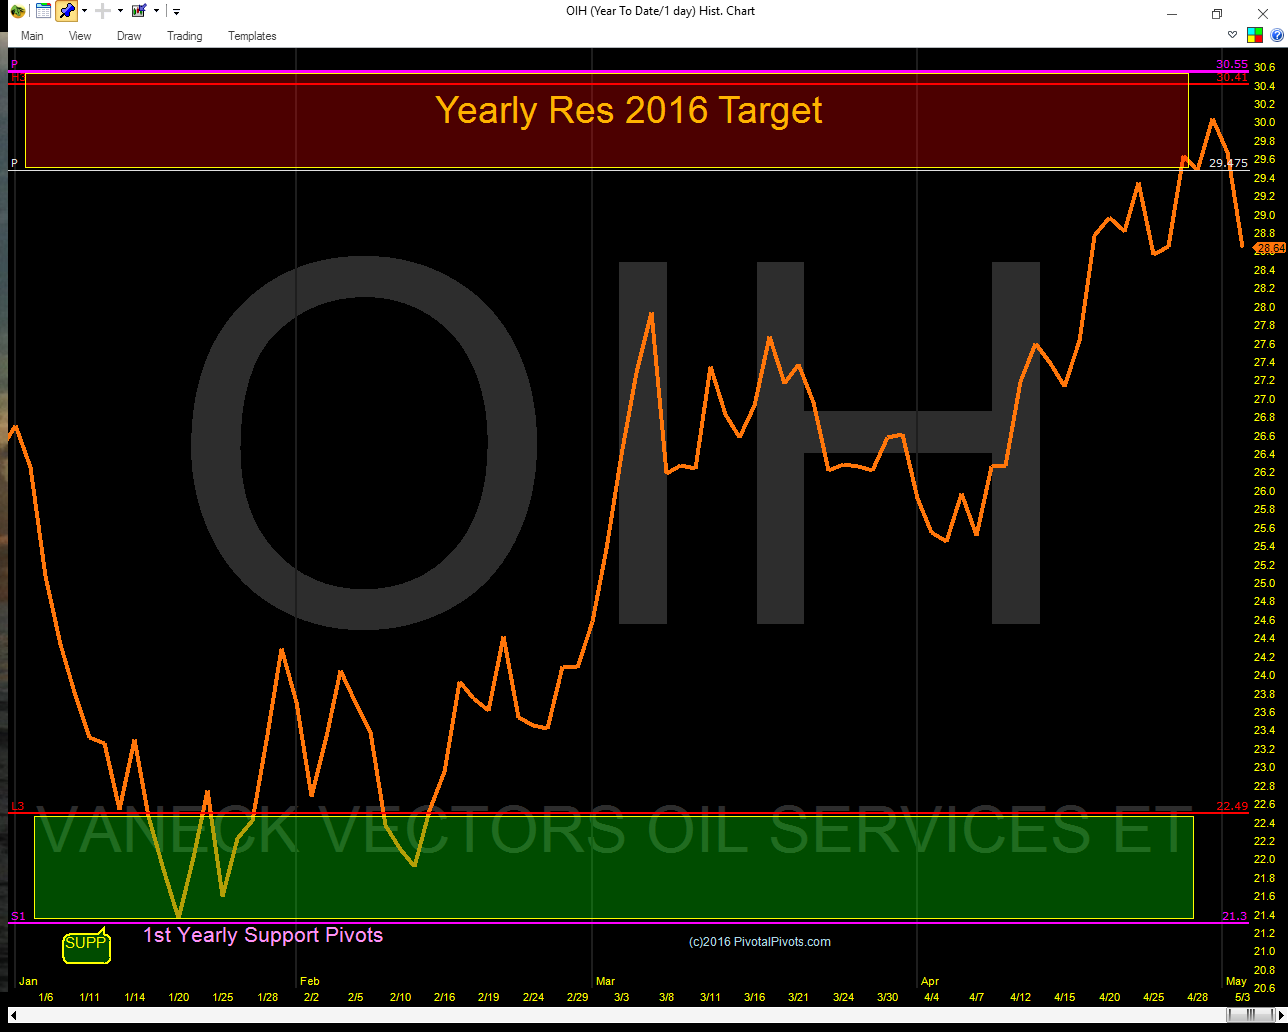
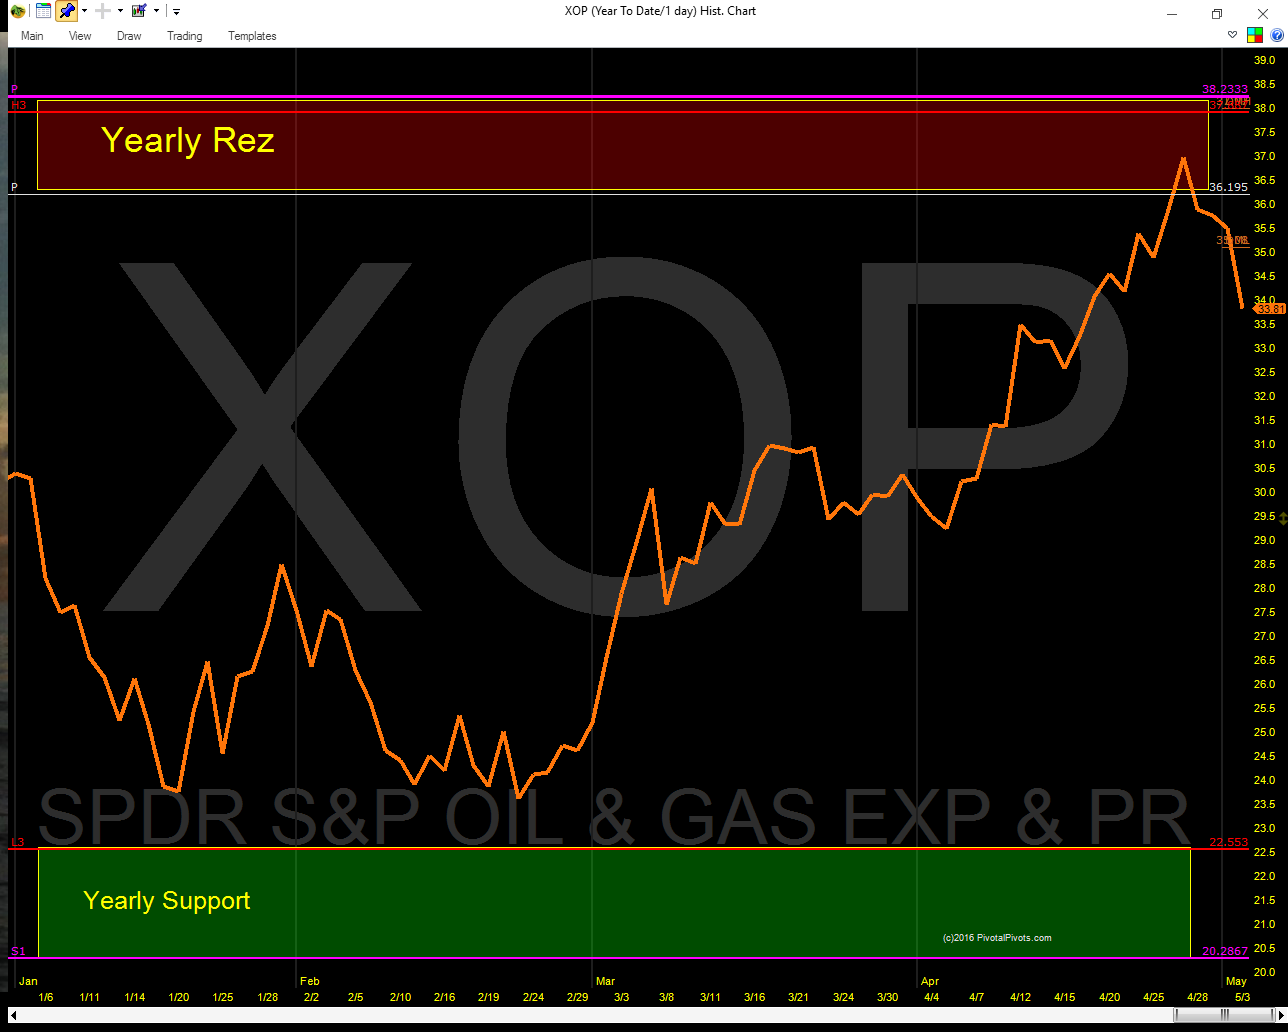
The price of CL (crude oil futures), OIH (the oil services ETF), and XOP (the oil drillers ETF) have all completed their “Pivot Price Patterns” from the YearlyS1 pivots to the the Yearly(P) pivots. When price bounces off the S1 pivot it is a clue that tells us there is an 80% chance (odds) price will go up to its Yearly(P) Pivot. Remember, several computer trading algorithms move price “Pivot2Pivot.
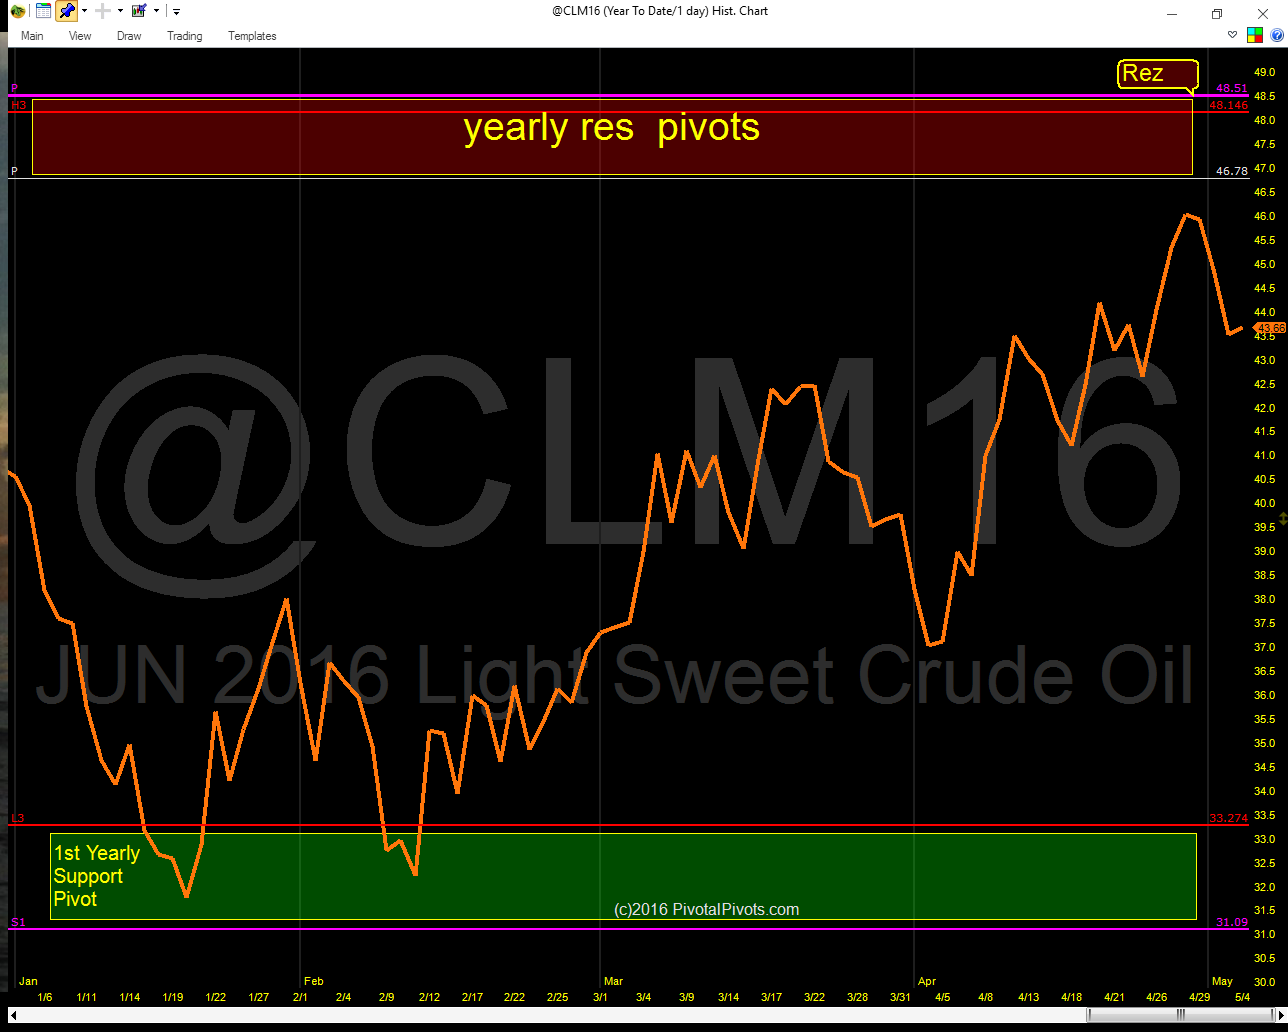
The June crude oil futures contract is close to completing a “Pivot Price Pattern” from the YearlyS1 pivot point to the Yearly(P) point at $48.51. This is where I am looking for the oil rally to top out. The seasonal trade in oil prices from Jan -May is almost over. And as you can see on the charts below, the yearly pivots have showed us where to buy and where to sell. No guessing. No drawing lines or lagging indicators needed.
Crude Oil Futures
OIH – Oil Services
XOP – Oil & Gas Drillers
Thanks for reading and have a great weekend.
Read more from Jeff: Apple Update: Watch Those Pivots!
Twitter: @Pivotal_Pivots
The author does not have a position in the mentioned securities at the time of publication. Any opinions expressed herein are solely those of the author, and do not in any way represent the views or opinions of any other person or entity.


