Crude Oil prices have been trading higher of late and may be looking to keep the rally going. Last year’s brutal selloff of Crude Oil carried over into this year, but a near double bottom in January and March may be setting up for a continuation of the relief rally in Crude Oil prices.
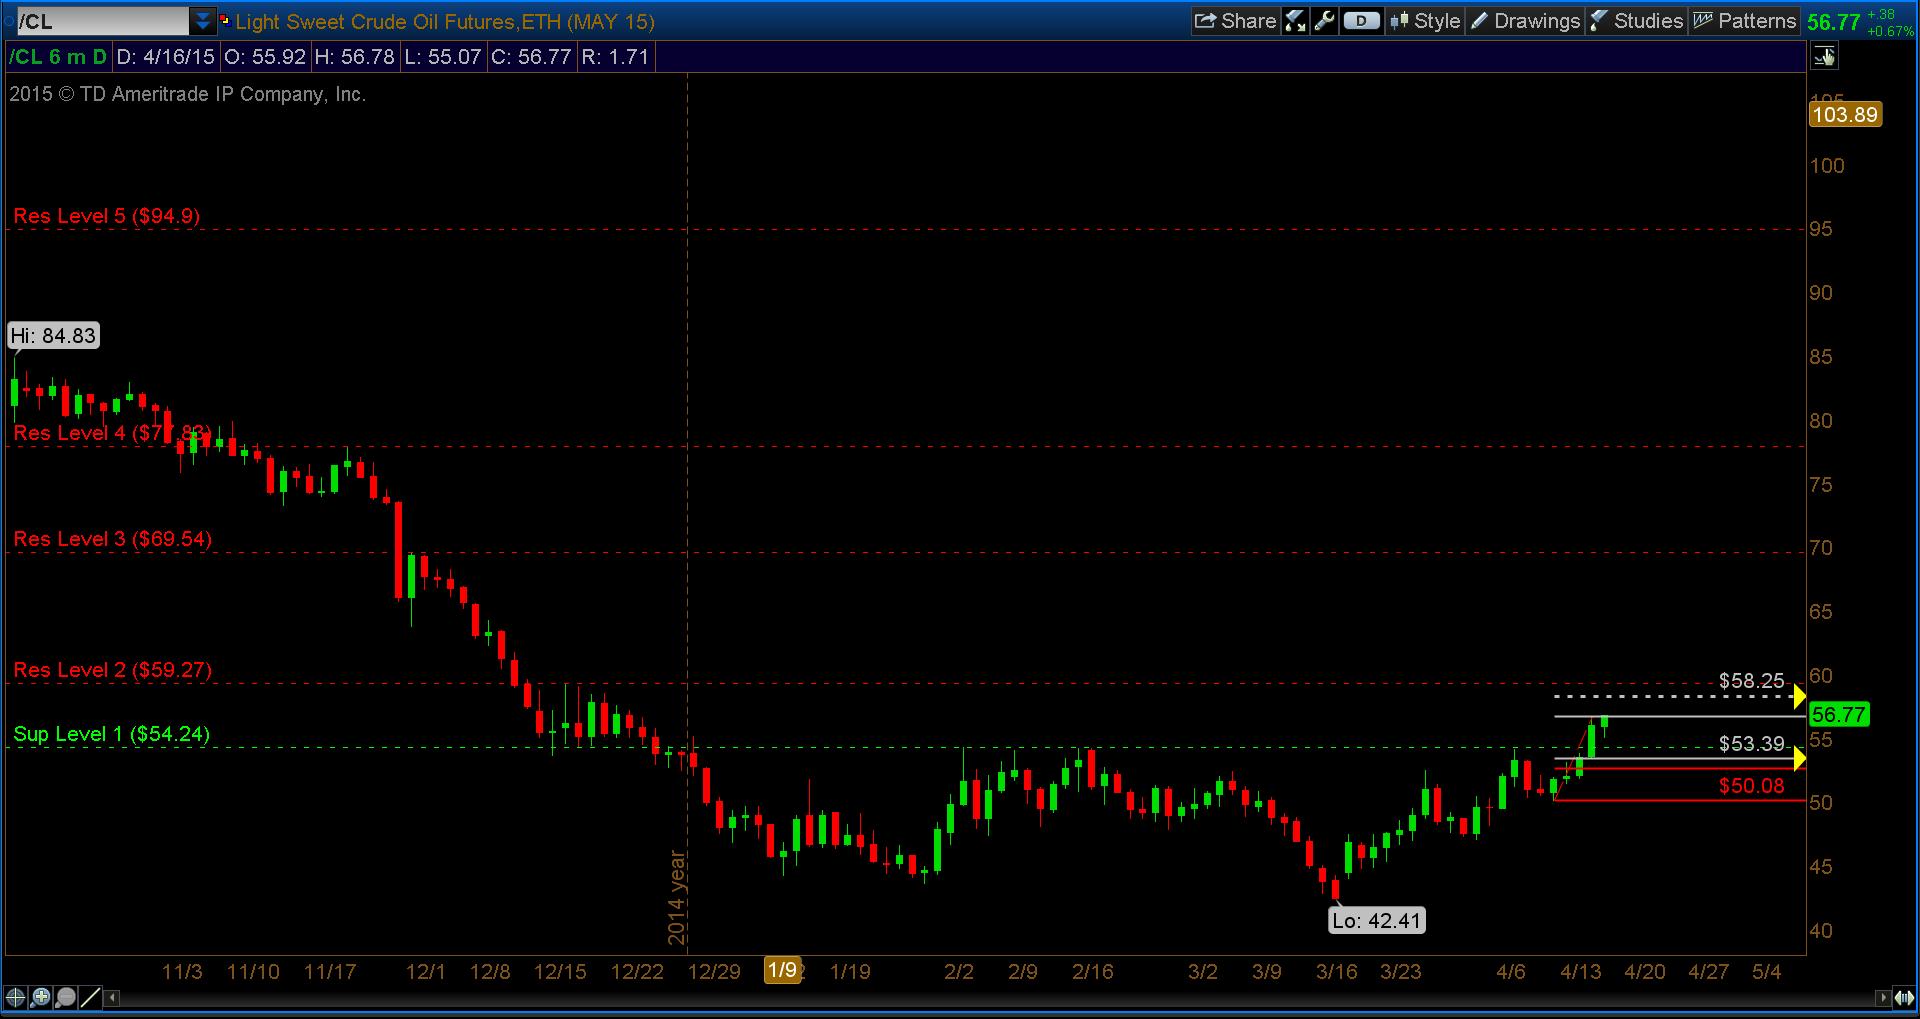
Below is a daily chart that is geared towards swing traders. Using my Fibonacci method, I have a current daily price target of 58.25 for Crude Oil. And note that after breaking out above resistance at 54.24, that level now becomes support.
Additional support levels come into play at 53.39 and 52.61, while longer term resistance levels stand at 59.27, 69.54, 77.83, and 94.90 (those last two are way up there, but worthy of mentioning).
Bullish traders will need lower support levels to hold to keep Crude Oil in rally mode near-term. Trade safe.
Crude Oil Prices – Daily Chart
Thanks for reading and remember to always do your homework and use a stop when trading!
Follow Dave on Twitter: @TheFibDoctor
No position in any of the mentioned securities at the time of publication. Any opinions expressed herein are solely those of the author, and do not in any way represent the views or opinions of any other person or entity.

 Rolling Over At Key Fibonacci Level?")


 Rolling Over At Key Fibonacci Level?")