Crude Oil prices continue to be a hot topic. And as news continues to stream out of the Europe regarding the ECB’s bond buying program, the falling Euro, and/or country elections, oil keeps falling. The news cycle this week is no different, as the Greek elections could pressure the Euro and, in turn, Crude Oil prices. Perhaps there is too much focus on Europe and its battle with deflation. That’s likely just one primary component to a larger global slowdown; clearly crude had (has) a major supply/demand issue as well.
But this week could be important, as Crude is set to test its 52 week lows after recording its lowest weekly close in over 5 years. And that means traders and chartists will have their eyes on Crude Oil prices this week.
On December 14, 2014, using my custom Fibonacci method, I derived a longer term target on (Light Sweet) Crude Oil futures (CL) of $45.46. At that time, crude was trading at $57.49 so a move down of another $12.03 or (20.9%) may have seemed like a stretch to some. The target of $45.46 was indeed hit 3 times on a daily basis before closing the target on Friday, January 23rd, 2015. Go back and read my original post and check out the charts for more information.
Now that the longer-term target has been hit and closed, we’ll need to do some chart calculations and see what’s possibly next for crude. Let’s start with a look at the big picture, a 20-year, monthly chart. Using an old but reliable method of drawing a simple support line, we can see in the chart below that a support level of $33.20 was made in January and February of 2009.
Light Sweet Crude Oil Prices 20 Year, Monthly Chart (click charts to enlarge)

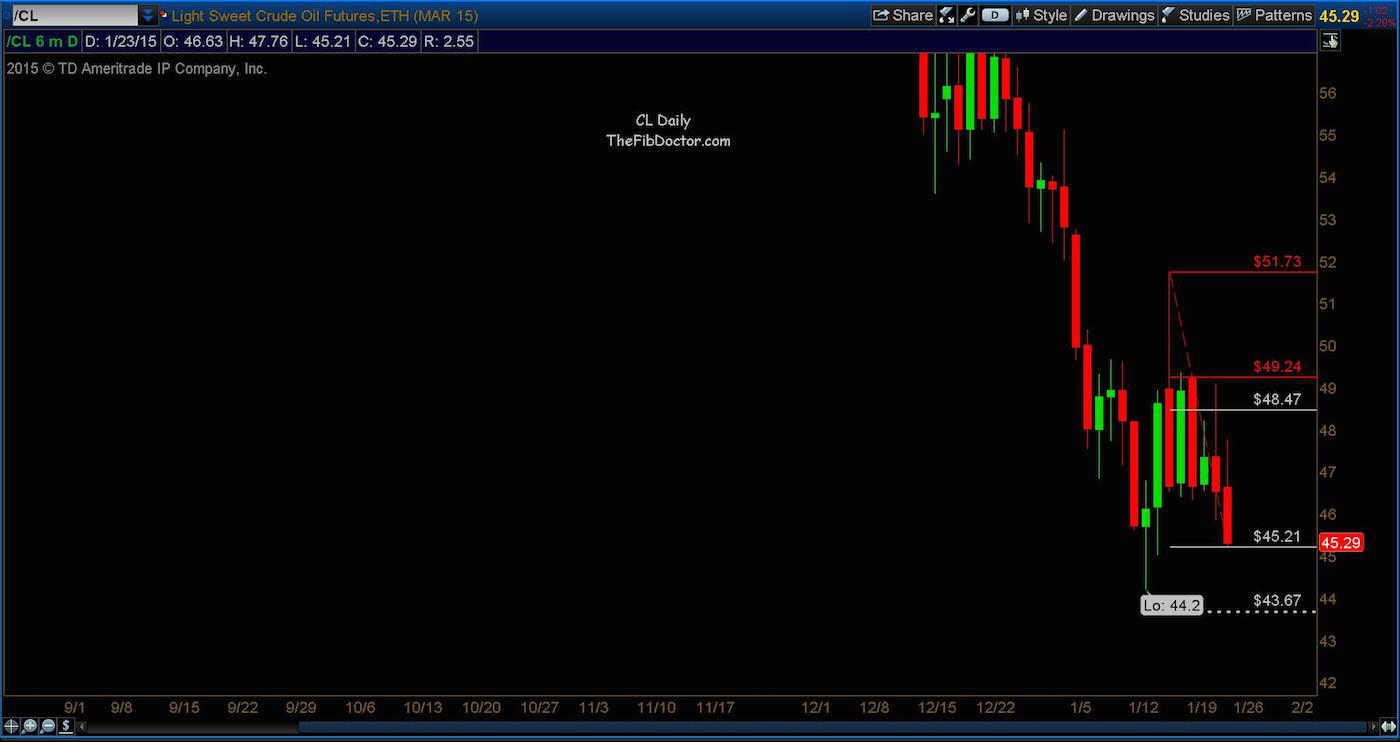
Now that the longer-term target has been closed, we’ll drill down to a daily chart and obtain a shorter term target. Again, using my custom Fibonacci method of acquiring future targets, you can see in the daily chart below we have a target of $43.67 with overhead resistance levels at $48.47 and $49.24.
Light Sweet Crude Oil Prices Daily Chart
For now, I’ll watch crude on a daily basis. If and when crude does make a substantial move up and gives me a valid point of reference, I’ll be able to redirect and compute another longer-term target.
Thanks for reading and remember to ALWAYS use a stop loss.
Follow Dave on Twitter: @TheFibDoctor
No position in any of the mentioned securities at the time of publication. Any opinions expressed herein are solely those of the author, and do not in any way represent the views or opinions of any other person or entity.

 Rolling Over At Key Fibonacci Level?")


