Oil prices have been trading on fire lately. In fact, Crude Oil futures are up 7 trading sessions in a row ending Friday 8/19. This has put multi-year highs back in sight near $52. Friday’s last trade came in at $49.12. How about crude oil futures seasonality?
That’s debatable and I discuss this further below. In short, crude oil futures seasonality has been strong into September historically, but very poor recently. This has traders, including myself, wondering if this extreme rally will reach a high this month (August) or next (September)?
Crude Oil Technical Analysis
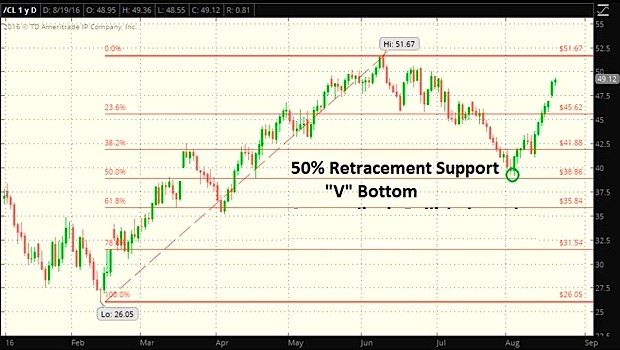
Technically, Crude Oil found support near the 50% retracement of the 2016 rally. The below YTD chart shows the $26.05 decade-plus low that printed in February, as well as the multi-year high at $51.67 touched in early June. The 50% retracement of that nearly 100% rally is $38.86; Crude’s low was $39.19 on August 3. The drop and pop in Crude Oil was a classic “V” bottom. This occurs when price declines rapidly for several trading periods, then buyers step in and shorts cover. It causes very swift rally.
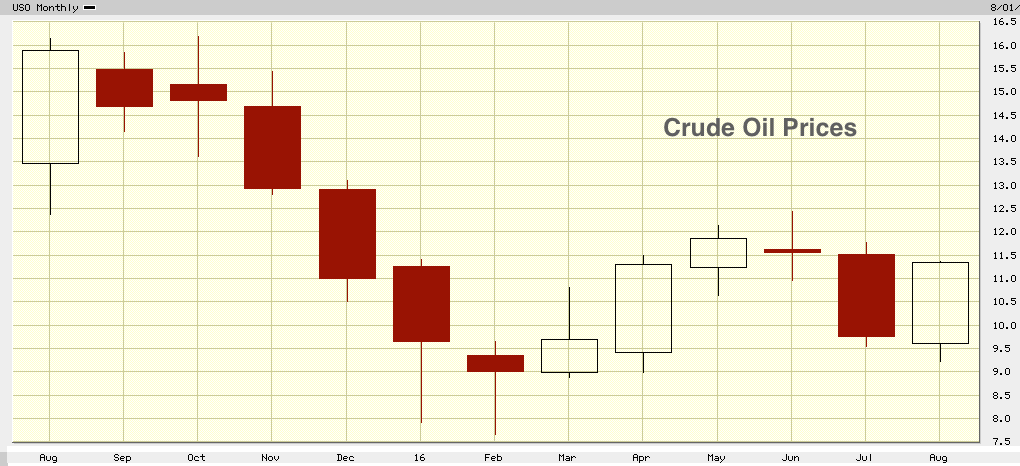
The popular Crude Oil ETF (NYSEARCA:USO) has a chance to print a bullish engulfing monthly candlestick. This is very impressive considering it fell 15% from open to close in July. This ETF comes with a performance caveat, though, as it suffers over time from contract rollover (contango).
Looking over at crude oil futures, it’s apparent that $51.67 will be important to watch as we head into the end of the month.
Crude Oil Futures Seasonality – September
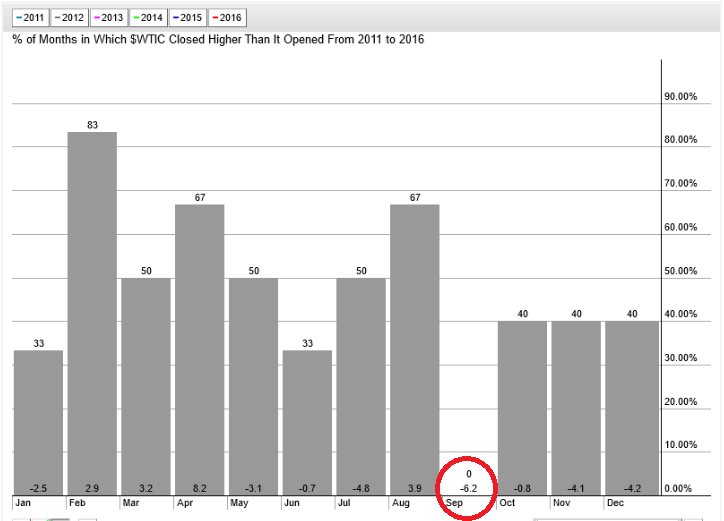
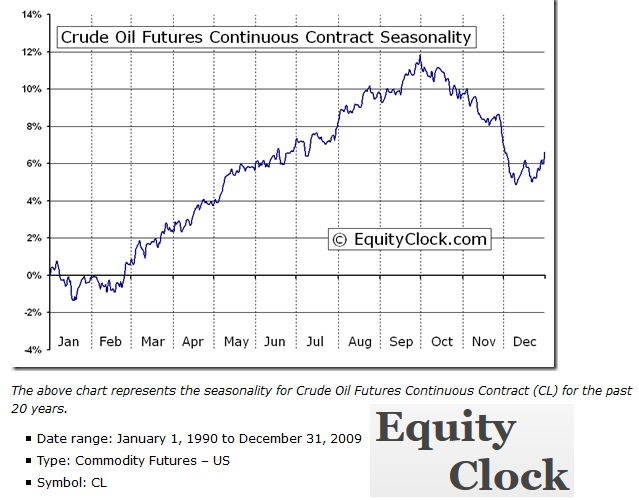
While longer-term Crude Oil futures seasonality is strong through September (using data from 1990-2009 via EquityClock.com), the last 5 Septembers have all been negative, with an average decline of more than 6%. It just goes to show that no one indicator is magical. Each technical indicator should be analyzed for its materiality, then incorporated into an overall weighing of bullish and bearish risks.
I invite you to review @optionshawk’s energy post for a longer-term view of Crude Oil and specific energy plays.
Thanks for reading.
Twitter: @MikeZaccardi
Any opinions expressed herein are solely those of the author, and do not in any way represent the views or opinions of any other person or entity.

 Rolling Over At Key Fibonacci Level?")


