As investors make their way through an uncertain time in the financial markets, they are undoubtedly watching several indicators. I humbly believe that one of those indicators should be crude oil. As most of you are aware, crude oil is one of the most important commodities on the planet. And a potential crude oil breakout pattern has been plotted by the recent price action.
BUT, it won’t be confirmed until/unless crude oil prices break above the green line (in the chart below).
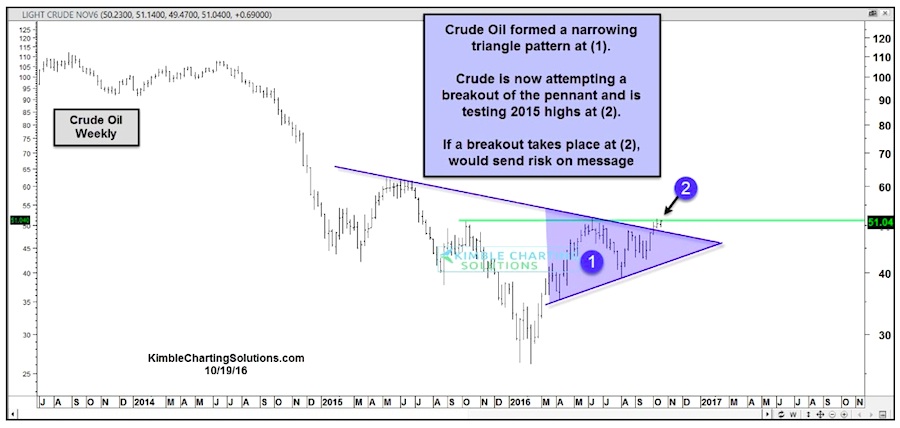
As you can see in the chart below, crude oil has been confined within a narrowing triangle pattern over the past several weeks. Then came October… and the recent Crude Oil breakout attempt. Thus far, oil prices have broken out above the upper pennant line… but crude has yet to move more than a few percent above it.
Crude Oil prices are currently testing its 2016 highs (point 2). If Crude can take out these highs, it should attract some additional buyers/investors and confirm the breakout. But that remains to be seen…
Crude Oil Weekly Chart
Thanks for reading.
Twitter: @KimbleCharting
The author may have positions in related securities at the time of publication. Any opinions expressed herein are solely those of the author, and do not in any way represent the views or opinions of any other person or entity.

")


