I have been away from the trading screens since Tuesday and only able to catch up at night. Below is my read on what was an eventful end to last week in the financial markets.
Feel free to also read my previous post on credit: Are The Credit Markets Signaling More Pain For Stocks?.
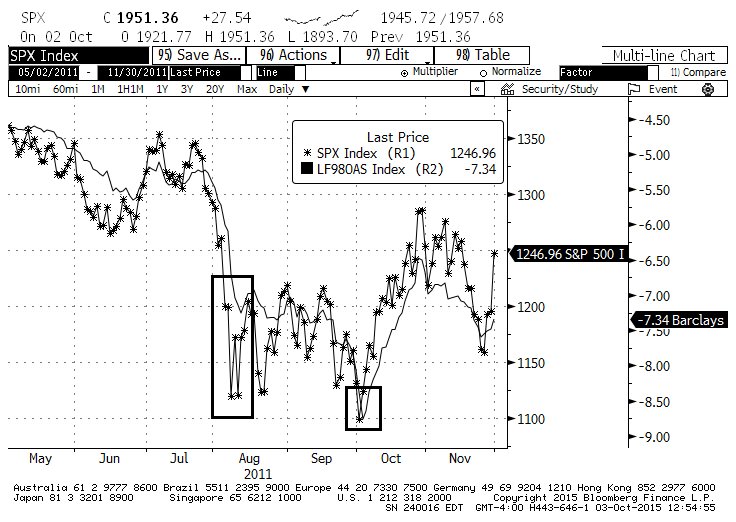
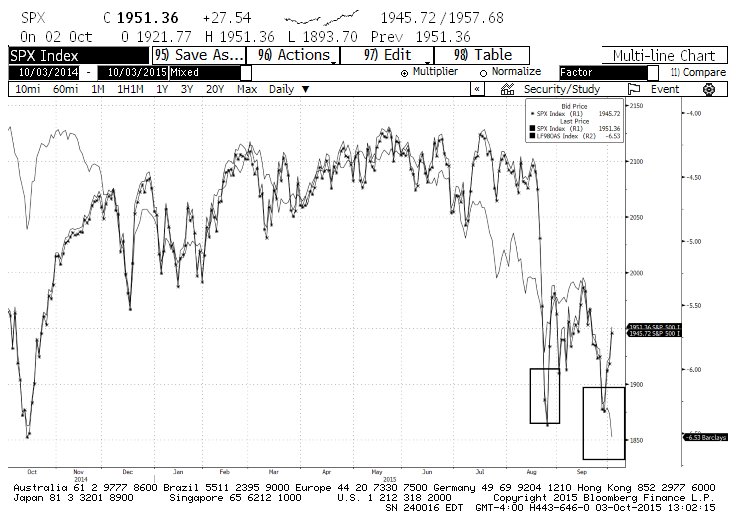
The credit markets are now meaningfully diverging from stocks on the negative side, to the point that stocks should be close to the August lows if they were to fall back in line with the credit markets. Back in 2011, both credit and stocks exceeded the worst levels of the initial plunge before finding a bottom and then rallying hard. Right now, only credit is retesting the August wides.
Not being in front of the monitors during Friday’s trading day I do not have a good feel for how the turnaround rally developed. Based on the closing numbers and prices of my watchlists, it looked quite strong. So it is possible that stocks will continue to rally and pull credit out of its funk, but that would be the exception to the rule that has been in place for the last 6+ years, i.e. not an odds-on bet. Also, DeMark counts on a number of credit measures suggest that the worst levels may be another 3 to 4 weekly bars away. If that plays out it will be exceedingly difficult for stocks not to revisit the August lows and perhaps go even lower.
So, if worried about missing a runaway upside move in the stock market (a legitimate concern because longer term that’s the most likely scenario) this may be a good time to remain nicely hedged. If worried about paying up too much for those hedges (implied volatilities are still high) it may be a good time to lighten up on longs. And if convinced that the credit markets will drag stocks lower (as it usually does) before bottoming out… well, I tend to agree with that.
Below are charts of the S&P 500 (SPX) and High Yield (HY) cash spread patterns for the 2011 correction (almost “bear market”) and for what has been the 2015 shakeout so far. History may not repeat, but it is continuing to rhyme.
SPX vs High Yield – 2011
SPX vs High Yield – 2015
Good luck and good trading!
Twitter: @FZucchi
Author has a related long position in the S&P 500 (SPX) at the time of publication. Any opinions expressed herein are solely those of the author, and do not in any way represent the views or opinions of any other person or entity.


