The following is a recap of COT data (Commitment Of Traders) released by the CFTC (Commodity Futures Trading Commission) looking at futures positions of non-commercial holdings as of April 28, 2015. Note that the change is week-over-week.
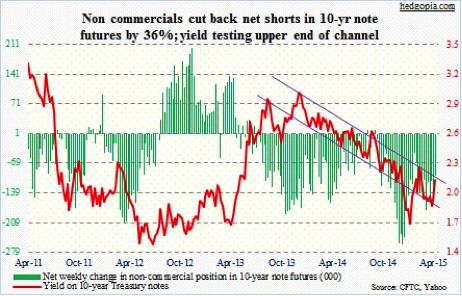
10-Year Note: The week was a head-scratcher from the standpoint of bond vigilantes’ reaction. The 10-year yield rallied hard on a very weak 1Q15 GDP report (makes little sense). For the week, rates rose 20 basis points! Is the bond market treating sluggish GDP with a grain of salt, or as a one-off? Or did yields rise on coattails of German Bunds, which sold off hard? Or maybe because corporate issuance was heavy this week, with both Oracle Corp (ORCL) and Amgen Inc. (AMGN), among others, tapping the bond market?
To be clear, Treasuries were acting as if they wanted to go lower even last week. The yield closed out last week at 1.85 percent.
Whatever the reason for the jump in yields this week, the move was not completely in sync with signals coming out of other assets. Reacting to the same GDP report, the dollar sold off (makes sense). But then the Fed continues to expect the effect of oil prices on inflation data to be temporary. The FOMC minutes continued to hint at a rate hike later this year (does not make sense).
Right here and now, COT data shows that the non-commercials nailed it. They had increased net shorts by 37 percent last week, and were amply rewarded. This week, they cut back by nearly as much. With the move this week, the 10-year yield is right underneath the upper end of the channel it is in. So unless there is a breakout, odds of rates heading back down to test its 50-day moving average (at two percent) are high.
Currently net short 98.6k, down 54.8k.
30-Year Bond: After Wednesday, market participants will probably begin to pay more attention to the Atlanta Fed’s GDPNow forecast, whose 0.1 percent growth forecast was pretty close to the actual print of 0.2 percent. The consensus forecast of 1.1 percent growth was wildly optimistic – out of line with sluggish readings in several other data points.
Durable goods, for instance. Orders for non-defense capital goods ex-aircraft have had monthly declines since last August. Come Monday, factory orders will be out. This will be the full report for March. The advance report on durable goods was already out on April 24th, so the new report likely will not contain much surprise or change the downward momentum for that matter.
ISM non-manufacturing is on Tuesday. Services are holding up much better than manufacturing. In March, the non-manufacturing index was 56.5, versus 58.8 last November, and the new orders index at 57.8, down from 62.6 last July. Incidentally, ISM’s manufacturing orders index inched up to 53.5 in April from 51.8 in March.
Productivity numbers for 1Q15 come out on Wednesday. Non-farm business productivity fell in 4Q14 – the first year-over-year drop since 3Q11. The trend is not encouraging. In 2014, output per hour only rose 0.7 percent, preceded by growth of 0.9 percent in 2013, one percent in 2012, and 0.2 percent in 2011. The significance of this data series cannot be emphasized enough as GDP is a function of population growth and productivity.
Friday is big. We will find out if the March employment report was an aberration or the beginning of a trend. A mere 126k non-farm jobs in March was a shocker! Spoiler alert! The ISM employment index for April dropped below 50 to 48.3 – first sub-50 reading since May 2013. Lots of eyes will obviously be focused on progress in wages, or a lack thereof. Average hourly earnings continue to remain subdued, with year-over-year growth unable to sustain above two percent throughout this recovery.
Seven Fed officials, including Chair Yellen, are on schedule to speak.
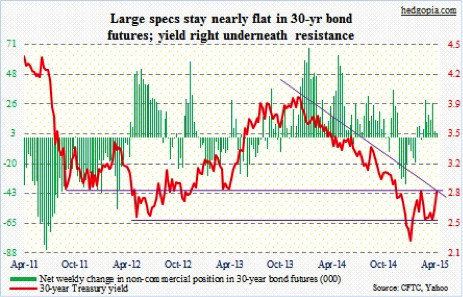
As is the case with the 10-year, the 30-year yield finds itself right underneath where two different resistance levels converge – December 2013 downtrend line and September 2011 horizontal line.
Currently net long 3.5k, down 1.3k.
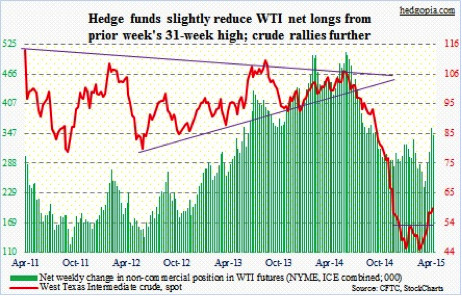
Crude Oil: In the week ended April 24, Cushing crude inventories fell by 514,000 barrels, to 61.7 million barrels (as per the EIA). Stocks had been rising since last November. So this was a welcome relief, and oil bulls simply ran with it. In the week, the WTI rose another three-plus percent, and now finds itself at an interesting juncture.
After the mid-April break out of 54, it went sideways for two weeks, which it broke out of Thursday. The latest breakout gives a measured target of 60, which was all but hit Friday. With this, daily technicals are now grossly overbought. This is as good a spot as any for a breather. Support lies at 58, then 56; 54 is a must-hold. As long as 54 holds, we have a double bottom.
Currently net long 343.6k, down 14.2k.
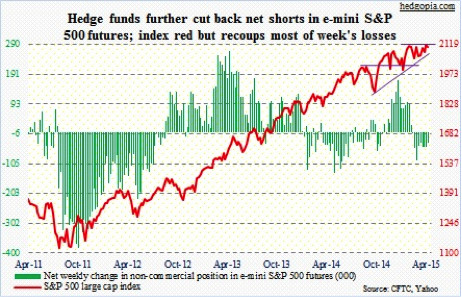
E-mini S&P 500: What a week! A roller-coaster within a tight range – only 48 points – nonetheless both bulls and bears could probably boast of victory. The week began with a hard reversal on Monday – score one for the bears. And they scored again when they were able to push the index through the 50DMA on Thursday. But the bulls scored back the day after reclaiming that average.
We will find out next week if the Friday action was merely a result of mutual funds getting active at the start of a month or we will see follow-through buying in stocks. The good thing if you are a bull is that the mid-October trendline was saved – for now.
One interesting tidbit came from Fred Tomczyk, CEO of TD Ameritrade. With 6.5 million customer accounts, he told CNBC that retail investors are “pretty fully invested” in stocks, adding that margin loans are at high levels, client cash is at low levels, and that account holders are logging in frequently.
This should not come as a surprise given NYSE margin debt rose to an all-time high in March.
The COT data shows that Non-commercials continue to cut back net shorts, which were as high as 94k mid-March.
Currently net short 34.6k, down 13.6k.
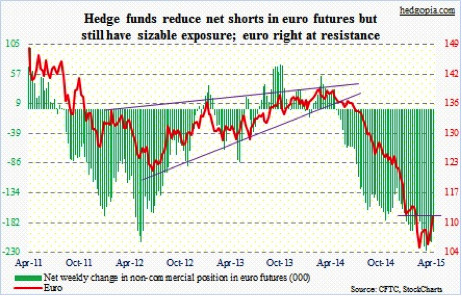
The Euro: Mario Draghi, president of the ECB, was probably not a happy man this week. Both the euro and interest rates came under upward pressure. Was it because the funds that sought to front-run the ECB purchase of bonds were locking in profits? Or maybe they were just reacting to macro data. Euro area bank lending increased in March for the first time since 2012. Consumer prices were zero in April, ending a four-month streak of declines. For reference, the ECB expects zero inflation this year, rising to 1.8 percent by 2017. A ways to go!
The currency added another three percent in the week, in the process pushing through the 50 Day Moving Average (DMA). On a weekly chart, there is room for it to rally more, but a daily chart is grossly overbought. Perhaps time for a breather. It is right on resistance.
Currently net short 197.8k, down 16.9k.
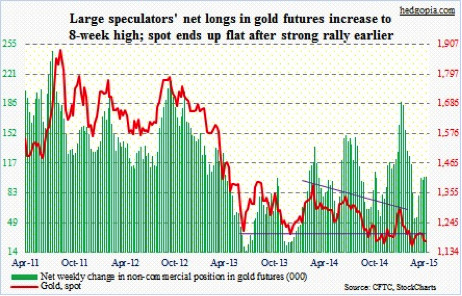
GOLD: The metal was flat for the week, but swings were wide – $47 from low to high, to be exact. For the third consecutive week, a weak dollar was unable to provide a tailwind for Gold. The bearish MACD crossover that was set off last week is still in place. The weekly indicators have room to push lower still.
Non-commercials continue to remain optimistic.
Currently net long 101.3k, flat.
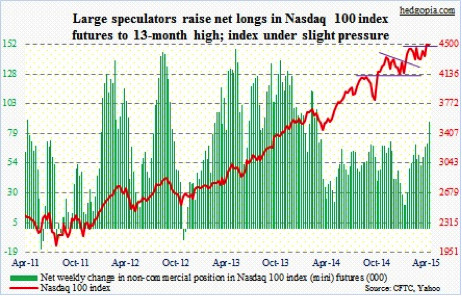
Nasdaq 100 index (mini): After a new closing high for the index last week, it was logical to expect these traders to try to keep the momentum going. That they did, having raised net longs to a 13-week high. But it was a choppy week.
Last week, the Nasdaq 100 (NDX) broke out of 4480. This week, it lost that, before rallying back to it on Friday. Needless to say, next week is crucial. Biotech stocks were a big help on Friday (The iShares Biotech Sector ETF – IBB – was up 3.1 percent, but down 5.4 percent for the week). How Apple Inc. (AAPL) behaves could turn out to be a make-or-break for the tech sector. Its CY1Q15 results were great, but investors used the Tuesday pop as an opportunity to bail, in the process carving out a large engulfing candle.
Currently net long 88.4k, up 18.2k.
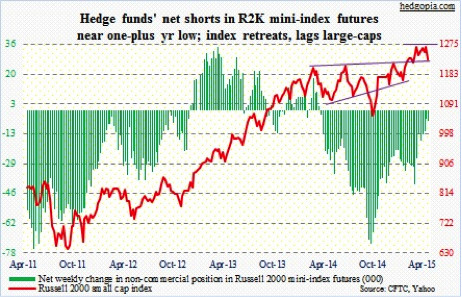
Russell 2000 mini-index: As April began, small-cap stocks began to lag large-cap stocks. That streak continued this week, as the Russell 2000 Index (RUT) slumped 3.1 percent, versus a drop of 0.4 percent for the S&P 500. With that, the small-cap index has sliced through its mid-October trendline. There is support at 1215, which it broke out of 12 weeks ago. In fact, buyers did show up near that level on Thursday. That technical support is merely one percent away, so another test is possible… as is a countertrend rally. Should that come to pass, shorts are likely to be all over this thing near the 50 DMA (1.6 percent away).
Money is beginning to come out of small-caps. In the week ended April 29, $722 million came out of the iShares Russell 2000 ETF (IWM) (courtesy of Bank of America Merrill Lynch and EPFR Global).
Currently net short 5.5k, up 1.1k.
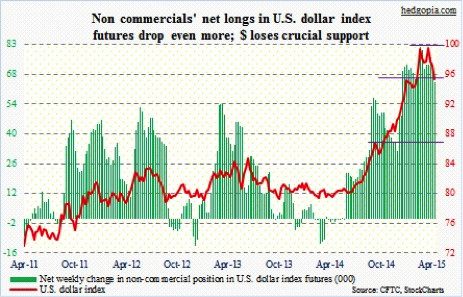
U.S. Dollar Index: In 1Q15, U.S. exports (real) shrank 7.2 percent. It is anyone’s guess as to what degree this has been caused by a strong dollar. But the months-long surge in the currency probably did not help. In a roundabout way, it has effectively acted as tightening. Using this logic, the higher the dollar index, the less the need for the Fed to tighten. And the longer interest rates are zero-bound, the weaker the reason for the dollar to rally.
The currency market may just be beginning to bet that U.S. rates are not going up anytime soon. Since mid-March, the US Dollar Index has had lower highs, with a break of the 96 level; it has lost five-plus percent. Near-term, though, conditions are oversold. Shorts will probably begin to get active at 96-97.
According to the COT data, Non-commercials have been gradually cutting back (though ever so slightly).
Currently net long 64.6k, down 7.1k.
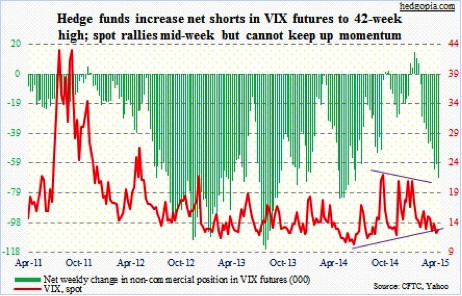
VIX: For the second time in two weeks, a rally attempt got rejected at the 200 DMA – on both occasions at just north of 15. Two weeks ago, it quickly gave back three points. This time, it has already dropped below 13. Next week probably is setting up as a duel between daily and weekly conditions. The latter is just about to make a big move, while the former could very well be itching to go lower. So potential downward pressure near-term could be opening up room for a move much higher looking out a few weeks.
As things stand now, these traders are positioned for a move lower. If they are right, daily conditions will have prevailed over the weekly ones – for now.
Currently net short 68.7k, up 8.8k.
Thanks for reading.
Follow Paban On Twitter: @Hedgopia
Read more from Paban on his blog.
No position in any of the mentioned securities at the time of publication. Any opinions expressed herein are solely those of the author, and do not in any way represent the views or opinions of any other person or entity.


")

")

