 Many are aware of the the recent US Dollar strength. As well, many are aware of the weakness in commodities. After all, strong moves in the US Dollar (up or down) tend to effect commodity prices. Take Corn prices for example. Let’s just say the recent run higher in the buck has hit Corn pretty hard. Or at least this chart says so:
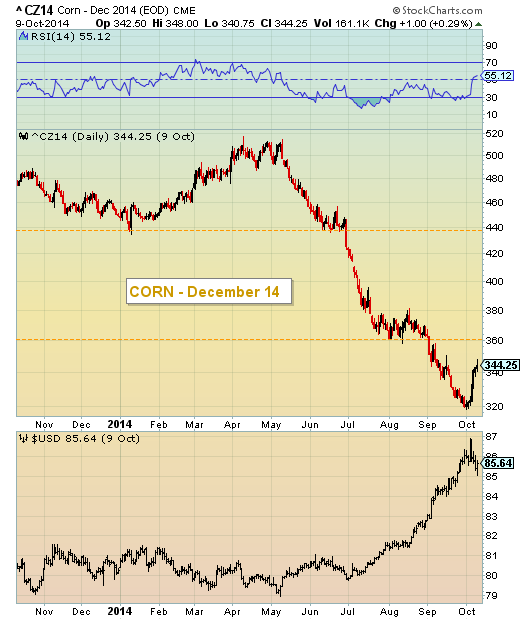
Couple the strong buck with a bumper crop, and you get a huge selloff in the grain sector. But, as you can see, the recent pause in the dollar has allowed Corn prices to rally. The next pullback will give us some insight into Corn’s next move. And perhaps that pullback is underway as prices are down nearly 10 cents/bushel thus far today (the chart above is EOD for December futures).
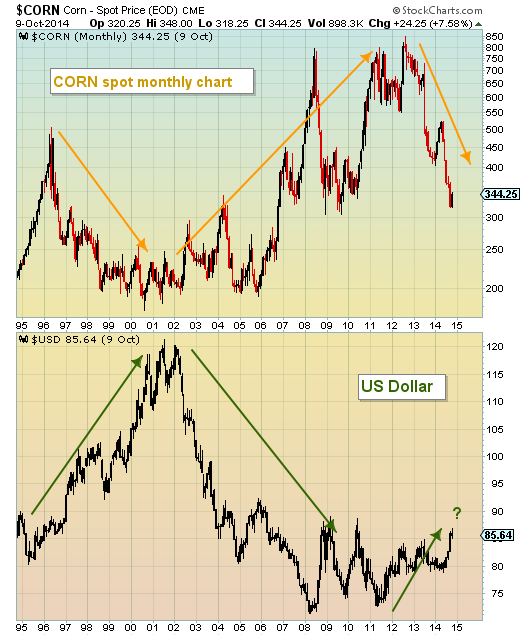
And, if you’re wondering about the look of a longer-term chart vs the US Dollar, here’s a 30 year chart of both. Very generally speaking, longer-term moves in the dollar have had an affect. But as the global economy continues to change and develop, perhaps some of these US Dollar correlations will decouple.
Corn price/bushel vs US Dollar Index (Monthly Chart over 30 years)
Note that Teucrium Commodity Trust Corn Fund is an ETF that tracks along with price movement.
Follow Andrew on Twitter: @andrewnyquist
No position in any of the mentioned securities at the time of publication. Any opinions expressed herein are solely those of the author, and do not in any way represent the views or opinions of any other person or entity.


 Ready To Break Out?")


 Ready To Break Out?")
