 By Andrew Nyquist
Since the late 2011 highs, Copper has shown relative weakness to equities… and for that matter, to almost everything else on the trading planet. The crisis in Europe peaked around that time and dropped Copper deep in the hole on escalated global growth fears. Those fears have morphed into a slow growth accepted reality that has kept the metal down.
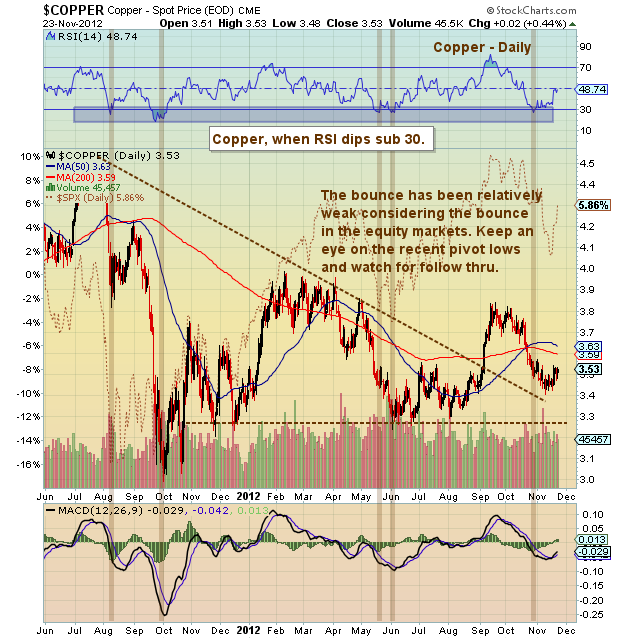
On November 3rd I posted “Copper Prices Heavy But Rebound Nearing.” At the time, its RSI had dropped below 30 and a rebound appeared imminent. After a few more heavy days, the metal rebounded with equities. However, as equities picked up steam, rallying over 5 percent on most major indices through Friday, Copper continued to lag.
The bounce has been weak to say the least. Copper followers should continue to monitor this weakness, eyeing the recent pivot lows for one of three options: 1) a breakdown 2) retest and follow through surprise 3) an RSI divergence.
Trade safe, trade disciplined.
More Charts here.
Copper spot price chart as of November 23, 2012. Copper chart with trend lines and technical support and resistance. Commodities – metal sector.
———————————————————
Twitter: @andrewnyquist and @seeitmarket Facebook: See It Market
No position in any of the securities mentioned at the time of publication.
Any opinions expressed herein are solely those of the author, and do not in any way represent the views or opinions of his employer or any other person or entity.


