Note that this article was sent to clients of LaDucTrading on February 1.
Spoiler Alert: We have no inflation in commodities.
Healthcare, Education, Concert Tickets … absolutely.
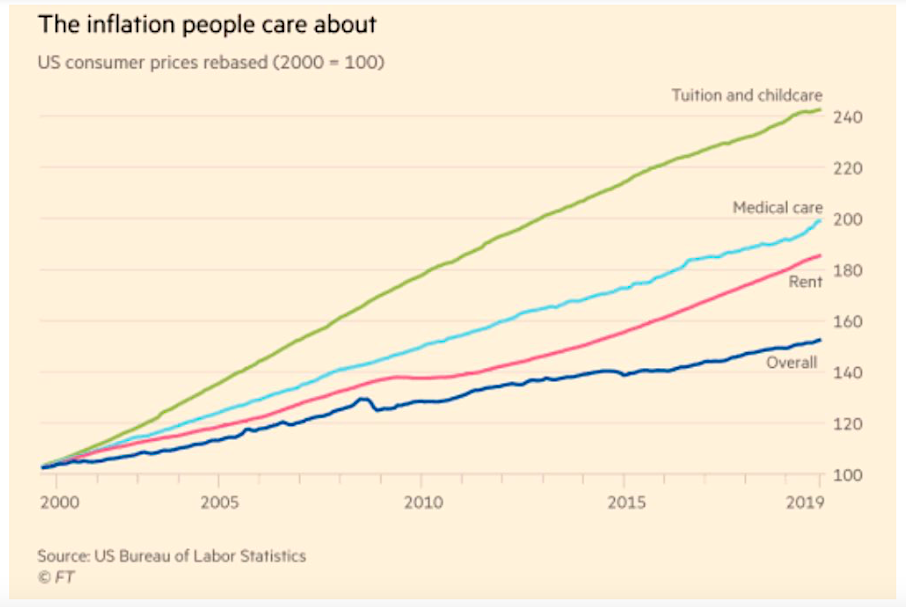
But what about the stuff we consume and use every day?
CRB Commodities is made up of the following weighting:
- Softs (Coffee, Sugar, Orange Juice) 23.5%
- Energy 17.6%
- Grains 17.6%
- Precious Metals 17.6%
- Industrials (Copper & Cotton) 11.8%
- Meats 11.8%
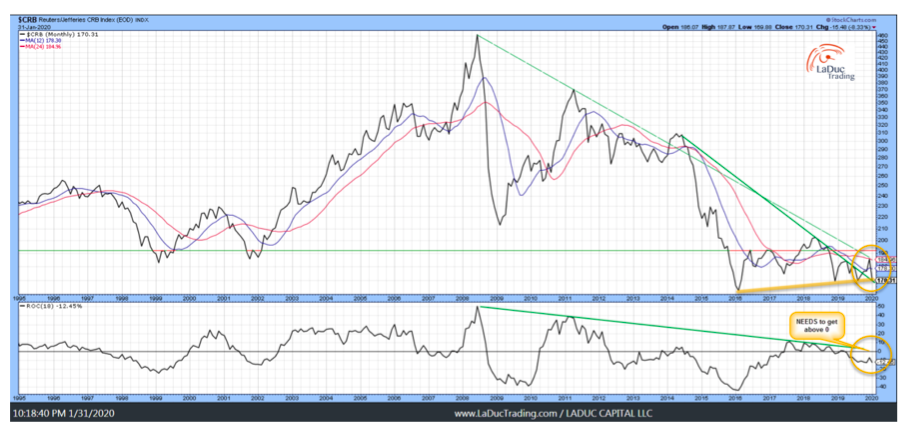
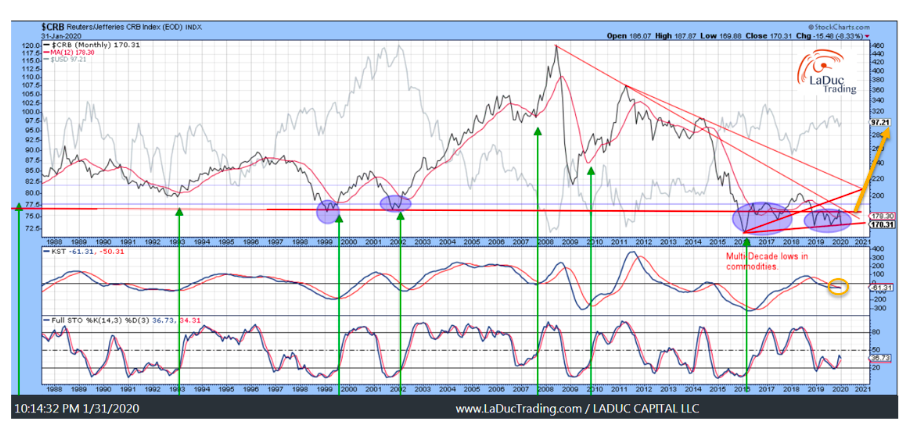
Commodities – Big Picture on a Monthly Time-frame – show that we are still in a multi-decade low.
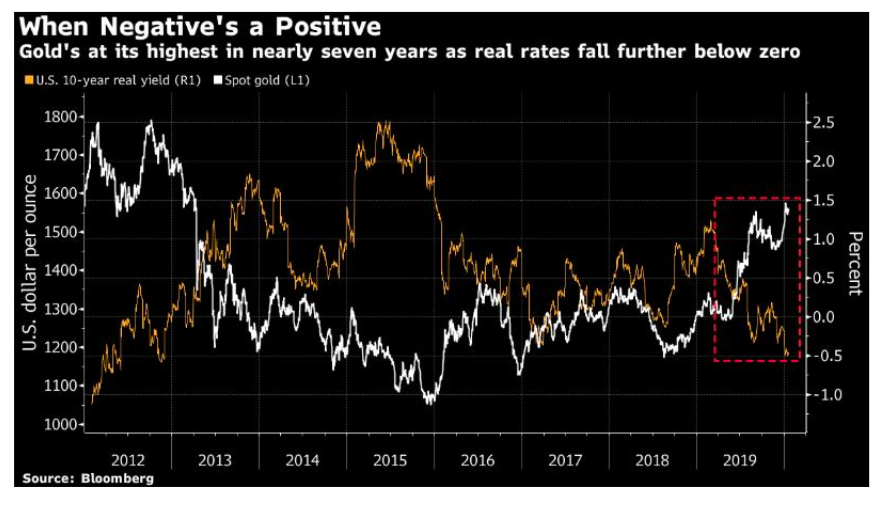
Yields have been falling, reflecting concerns about global growth, and also the dramatic change of direction by central banks, which was itself largely driven by fears for growth.
The 10-year Treasury yield is now almost a full percentage point lower than it was two years ago, and its trend is clearly downward. Indeed, if we take inflation expectations into account, the real 10-year Treasury yield has just gone negative.
According to the Bloomberg commodity indexes, industrial metals have now under-performed precious metals over the period since Donald Trump was elected U.S. president; and the price of oil is collapsing anew relative to gold. These moves only make sense if people are worried about growth. John Authers, Bloomberg
Sounds dreary, and John’s commentary was before the CoronaVirus outbreak really grabbed American businesses’ attention.
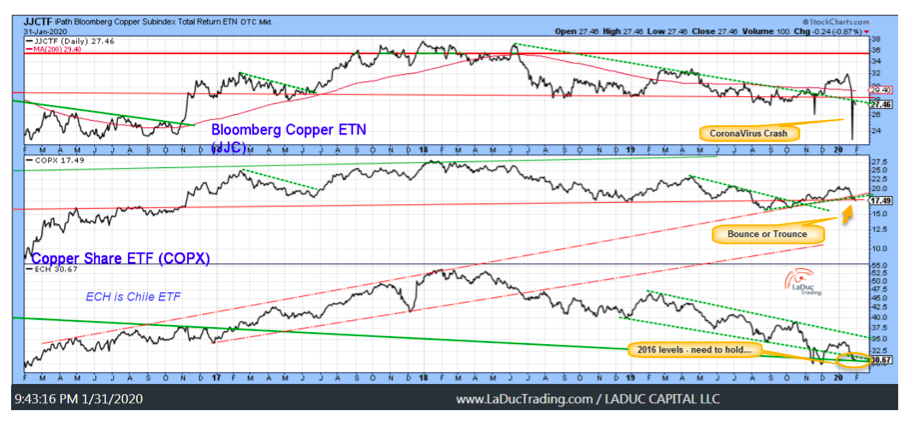
Despite my bearish leanings as detailed here: Perfect Storm: CoronaVirus and Market Risks, from my vantage point, we ‘should’ bounce soon (yellow circle). If not, we have more serious deflation to deal with – not just disinflation in the commodity patch.
Now let’s drop the USD softly behind the same chart and add some annotations. We have potential for a bounce, but also a lot of resistance and indecision. No clean signal yet. Still chop. And a DXY that has been range-bound for 4 years! Clearly, the US Dollar makes the weather for commodities and Foreign Exchange volatility as at an All Time Low. You know my saying: Outliers Revert With Velocity. Watch the USD for The Tell.
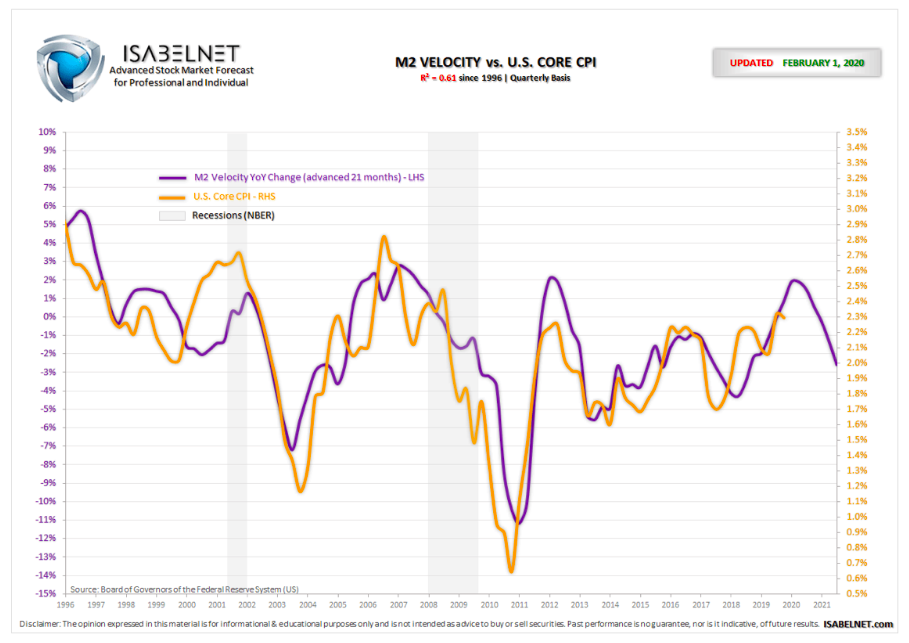
I should also add to this Intermarket analysis with the Macro read: it’s bearish inflation.
@ISABELNET_SA Chart is suggesting that M2 velocity YoY leads US core inflation by 21 months. It has been quite accurate for more than 20 years. And it portends lower.
Commodities Dead? Long Live Commodities?
So why fight the trend? Humor me for ‘the other side” of the argument. Let’s assume inflation catches a bounce, pulling up commodities and yields with it, what segments are most likely to rise?
Food – Softs, Grains, Meats: China is experiencing strong Food price inflation from drought conditions (Rice), culling of all that Pork (and soon Chicken?). But in the US, these input prices are declerating (Coffee, Corn, Hogs, etc). With the new Coronavirus shutting off the flow of goods into and out of China for the time-being – and I suspect until April/May – we could start to see a tick up in Food Prices. Worst case, as the pandemic spreads, people with be unwilling/unable to go to work which could also trigger supply chain constraints. Prices could accelerate quickly on supply contraction.
Energy: What’s the bull case for Energy? Oversold, “value” play with high trailing dividend yields? They are high for a reason and still major laggard of all SPY sectors several years now. Oil investment is waning not expanding (given Trump’s energy policies). So aside from a geopolitical ‘flare’ to temporarily disrupt supply, like with Iran, the case for sustainable higher oil is weak. And if/when Venezuela comes back online, it would be a big hit to the bull case (more supply). In the meantime, we have demand destruction out of China as a result of the CoronaVirus and general trends in decreasing demand due to:
1) Deglobalization
2) Decarbonization
3) Debt saturation
4) Donald Trump
Industrials: Copper is the big one, and it is at 2016 levels, so not expressing an economic growth look. Translation: The Trump Bump (2017) has been Dumped.
Precious Metals: Here are two charts that sum up my frustration on the perception versus reality of bidding up precious metals.
(Separate from the whole Palladium and Platinum play, which I have written about since early November as a bullish thesis.)
Treasury yields are negative after adjusting for inflation so that is supposed to be a plus for gold….
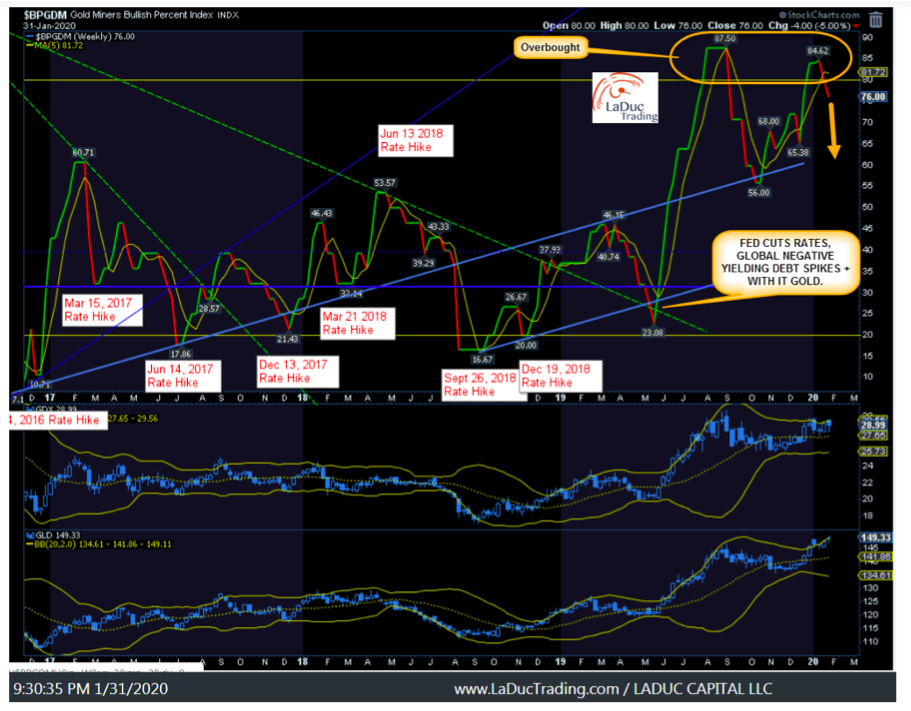
But, Gold/Silver Mining stocks are looking weary and potentially rolling over.
OK, I may have talked you out of a Commodity bump, but stick with me.
Commodities, The New Bonds?
Just over a year ago, the Fed finished systematically hiking rates (after 8 of them) as ECB quit QE. Today, Fed has lowered rates 3 times in 2019 and market is pricing in 2 more cuts for 2020! Fed clearly seems to unwind their 2017 tightening to avoid what happened in Fall of 2018 where U.S. stocks collapsed nearly 20% from Oct 3 to Dec 31st. Basically, the Fed realized it had spent three years tightening into a low inflation, low growth U.S. economy, and the global economy was too fragile to handle the liquidity and tightening drain.
But rate cuts at this point have reached the law of diminishing returns and Repo operations to inject capital in the money markets seems inadequate to jump-start growth. Fiscal policies in combination may be the fuel that flame inflation, in which case, commodities could recover and rally, but there are some heady headwinds:
Headwinds:
- demand destruction from slowing global growth from Coronavirus in particular, economic cycle and ‘protectionist’ trends in general.
- lower yields pull commodities with it, (and vice versa), but right now Fed has their proverbial thumb on any increases.
- global central banks have suppressed volatility by anchoring expectations with “lower for longer”, thereby enhancing the effect of rate cuts which suppresses commodities.
- a more dovish Fed also reduces the US-Foreign bond yield spread which strengthens the dollar, thereby suppressing local currency valuation while burdening thier USD funding obligations.
- a stronger dollar is tailwind to commodity run (inversely related since commodities are priced in USD).
Tailwinds:
- Local and Coordinated Global Fiscal Policies trigger global economic optimism; Debt and Deficit hawks be damned.
- Containment of CoronaVirus psychologically and financially allow for economic expansion. Both will drive yields higher.
Until these factors reveal themselves, yields are falling and at risk of breaking critical support.
Top 10 Reasons for Bond Reversal:
From Buy Bonds, Wear Zirconia:
- Yields are approaching my buy point just above All Time Lows.
- Bonds/Yields are on their respective Bollinger Bands/Keltner Channel bands (yellow circle on weekly chart) which often acts as resistance causing a rubberband.snap-back effect.
- Seasonal tendency to Sell Bonds starts Jan 31st.
- Nomura’s Charlie McElligott “1m Price Reversal” trade has run its course (1.94 drop to 1.64 in 10 yr yield since Dec 18th)
- Duration infatuation” (the safety-trade) often kicks in at the first sign of trouble, but then unwinds.
- The “normal” viral drag on US10Yr has the following tendency – yields fall then bounce back sharply.
- Fed won’t want the yield curve inversion which already erased half of the Q4 steepening.
- UPDATED PRE FOMC: Fed may need to guide inflation above target … which in turn supports a steeper curve, SO there is strong potential for final 2020 rate cut to CAUSE inflation expectations to rise.
- And the best reason potentially of all: Stocks are now Yielding More Than Bonds Again
In the early summer of last year, the 10-Year Treasury Note was bid up considerably, resulting in it yielding less than the S&P 500’s dividend yield. In fact, at the point of the largest divergence between the two in late August, the dividend yield of the S&P 500 was 56.9 bps higher than the yield on the 10-Year Treasury. Although the disparity between the two has shrunk from that August peak, that trend has generally continued in the months since then, though equities’ surge into the end of the year saw bonds briefly yielding more in December.
Since the start of the new year, stocks once again hold a higher yield, especially today as worries about the coronavirus have resulted in the selling of risk assets (raising the S&P 500’s yield) and subsequent buying of safe-havens (lowering the 10-Year Treasury yield). Now, the spread between the S&P 500’s dividend yield and that of the 10-Year is at its widest level in favor of the S&P 500 since October 10th. DATATREK
I am nothing if not persistent.
Here is my client post from January 24th on this related subject: All Alone With My Higher Yield Thesis:
High Yield corporate debt is in trouble with Oil dropping 20% since Jan 7th and Shale companies facing their biggest loan refinancing wall in 20 years. When HY credit passes 358 bp then Momentum will very likely sell off – like happened in early September 2019 – and Value will finally catch a sustainable bid! And when Hedge Funds cover their Value shorts, they sell Bonds! And when bonds get sold, with momentum selling off too, rates rip and we have a perfect storm set up for a massive VIX spike and gamma flipping.
That is still my baseline projection. Market just doesn’t see it yet.
Samantha LaDuc is the Founder of LaDucTrading.com and the CIO at LaDuc Capital LLC.
Start with FreeBait! Then take the next step: Come Fish With Me.
Twitter: @SamanthaLaDuc @LaDucTrading
Any opinions expressed herein are solely those of the author, and do not in any way represent the views or opinions of any other person or entity.
Editor’s note: Citation was updated and moved to top of article on February 6, 2020 at 4:21 pm central time.


