 I’ve covered the Russell 2000 (IWM) quite a bit on the chartology blog. I think it’s important as it gives you a general feel for current beta strength, but also a glimpse into macro picture.
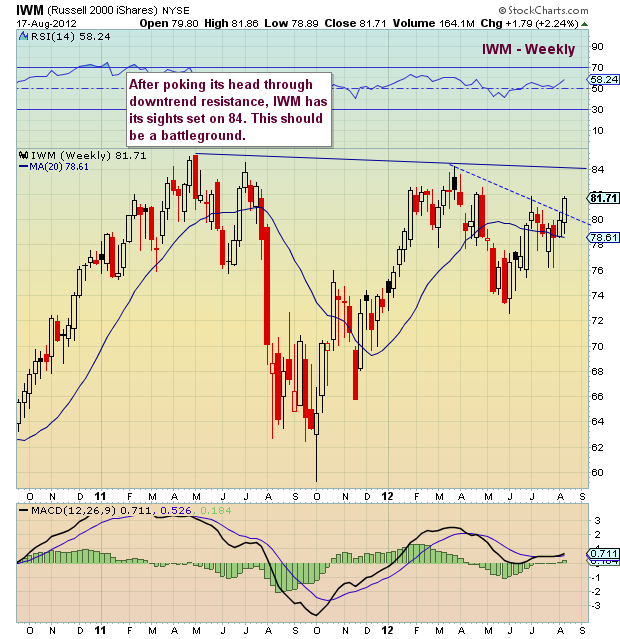
On beta front, the market is strong, as the index has powered higher (and through resistance) over the past 3 to 4 weeks. However, on the macro front, the IWM is still 4 to 5 percent off its 2011 highs, so lagging the general market a bit. If/when IWM gets to overhead resistance (84ish), expect a battle.
More charts found here.
Russell 2000 iShares (IWM) stock chart with technical analysis overlay as of August 17, 2012. IWM Price support and resistance levels with analysis. IWM stock chart with trend lines and technical support levels. IWM technical analysis. Small Cap stocks.
Twitter: @andrewnyquist and @seeitmarket Facebook: See It Market
No position in any of the securities mentioned at the time of publication.
Any opinions expressed herein are solely those of the author, and do not in any way represent the views or opinions of his employer or any other person or entity.


