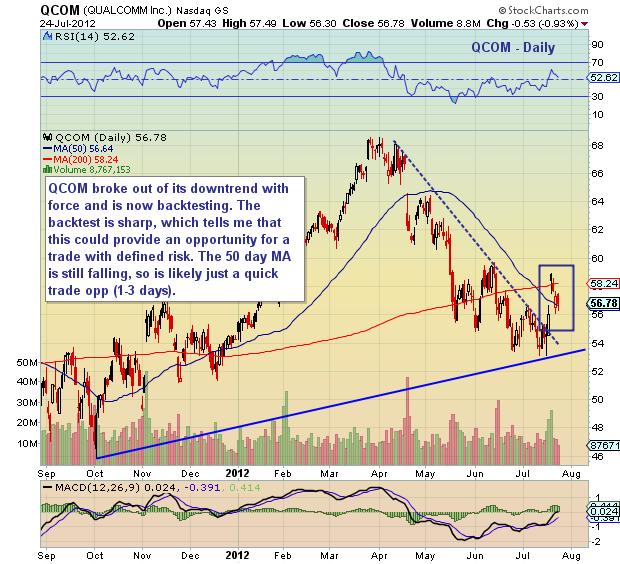
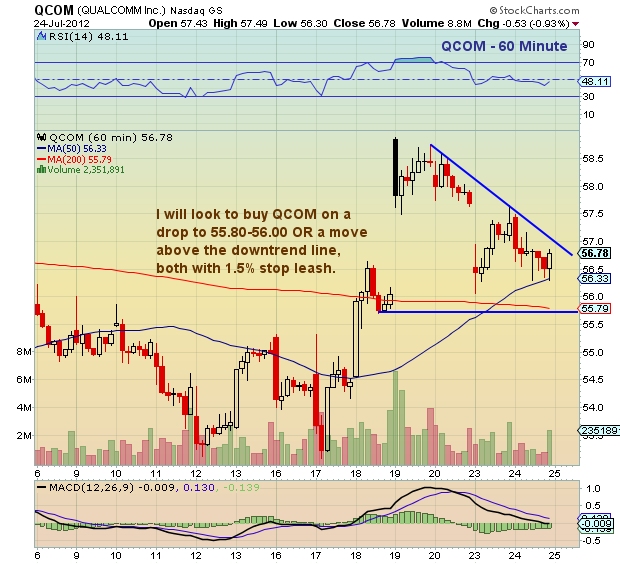
 Qualcomm (QCOM) recently broke out of its downtrend line and into a potential bullish flag pattern. This may offer a short term trading opportunity (or swing trade if the market can firm and defined risk – stops – hold). See charts below.
Qualcomm (QCOM) stock charts with price support and resistance levels and technical analysis as of July 24, 2012. QCOM breakout and flag pattern. Qualcomm stock chart showing price levels and possible targets.
———————————————————
Twitter: @andrewnyquist and @seeitmarket Facebook: See It Market
No positions in mentioned securities but looking to take a position in next 24 hours.
Any opinions expressed herein are solely those of the author, and do not in any way represent the views or opinions of his employer or any other person or entity.


