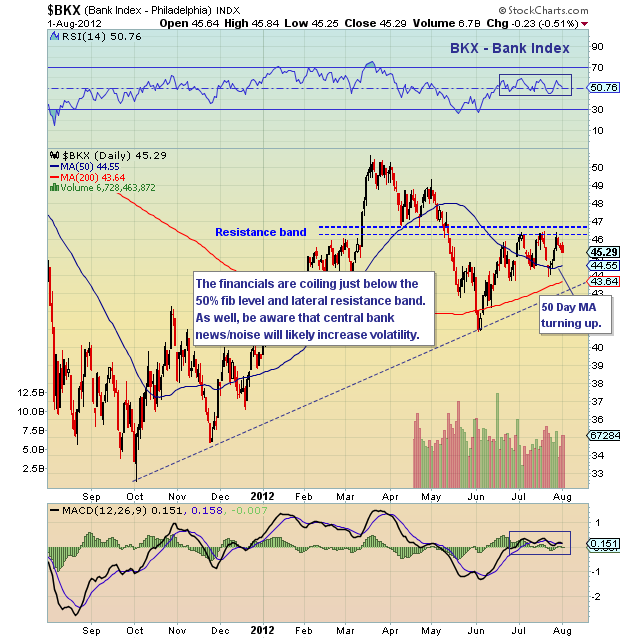
 The financials are facing an important crossroads of time and price. The Bank Index (BKX) has rallied back to the 50 percent fibonacci retracement of the March to June correction. As well, current prices are in and around a wider lateral resistance band. Keep an eye on this band, as a break higher would be bullish.
Note that the 50 day MA (moving average) has turned up and offers initial support, followed by the 200 day MA and uptrend line.
Bank Index (BKX) technical chart with support and resistance levels and trend lines. BKX technical analysis with fibonacci retracement levels. The BKX is representative of bank stocks and financials.
———————————————————
Twitter: @andrewnyquist and @seeitmarket Facebook: See It Market
No position in any of the securities mentioned at the time of publication.
Any opinions expressed herein are solely those of the author, and do not in any way represent the views or opinions of his employer or any other person or entity.


