In this chart spotlight, I want to share a tactical trading idea of mine: shorting select volatility ETFs and indexes. Patience is always the key, and swings are likely, but let me elaborate on what I am seeing and share several charts across the volatility space.
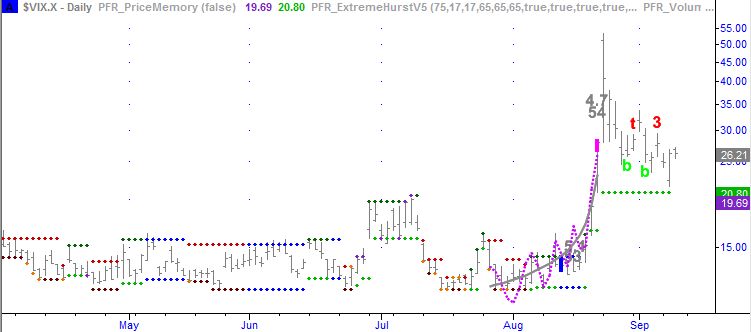
After the August stock market meltdown we got many independent top signals across the Volatility ETFs and indexes that I follow.
Although my long term forecast for stocks is flat to down through late 2018. it could be time to start thinking about taking advantage of the possibility of falling volatility.
In the charts that follow, the Magintude and Ranking of these signals make them relevant until at least late December. Picking your spots is always the key, especially as the markets search for footing here.
You can learn more about the Hurst Exponent by reading this post as well as ExtremeHurst Signals by watching this video.
VIX Volatility Index Chart
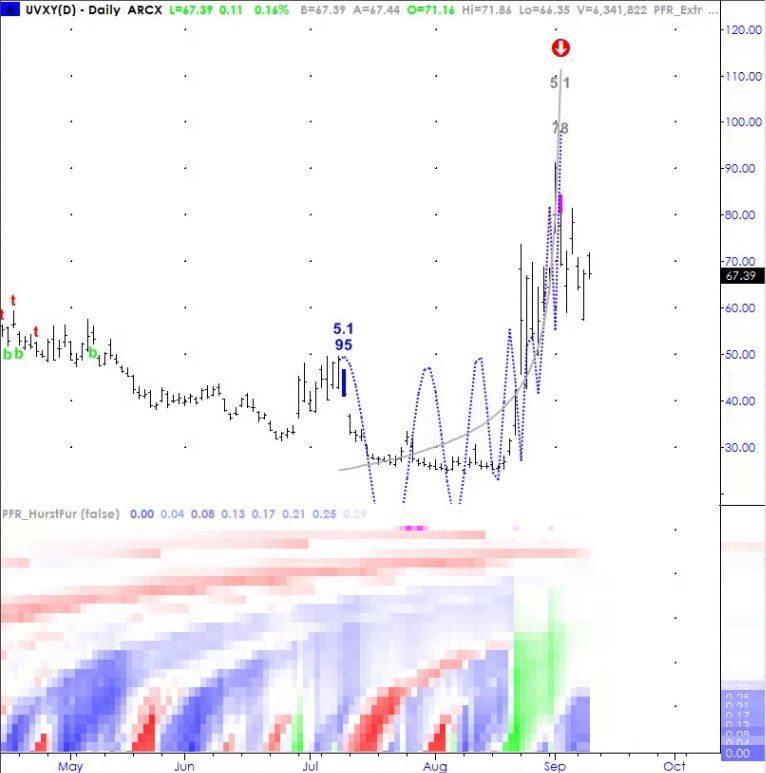
UVXY Volatility ETF Chart
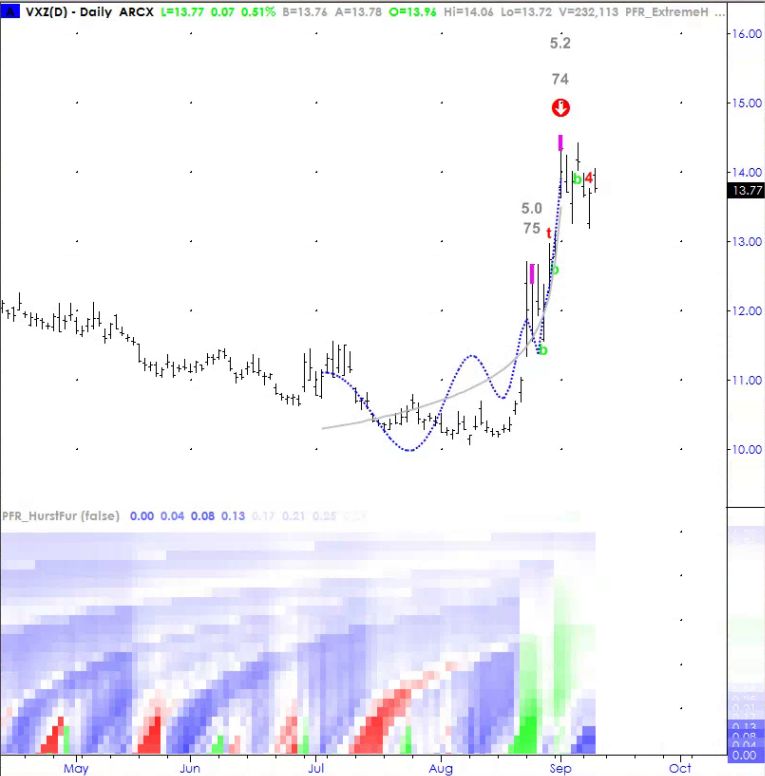
VXZ Volatility ETF Chart
Continue reading for more Volatility charts and analysis.


