With the entire commodity space taking another nose dive, a specialty pattern indicator that I have been focusing on just popped up on my radar again. The last time I received a signal like this, it was a sell signal on the Nasdaq futures (October 27th).
This time, the signal is in regards to Copper futures prices. And it’s a buy signal.
It also comes paired with a harmonic pattern confirmation.
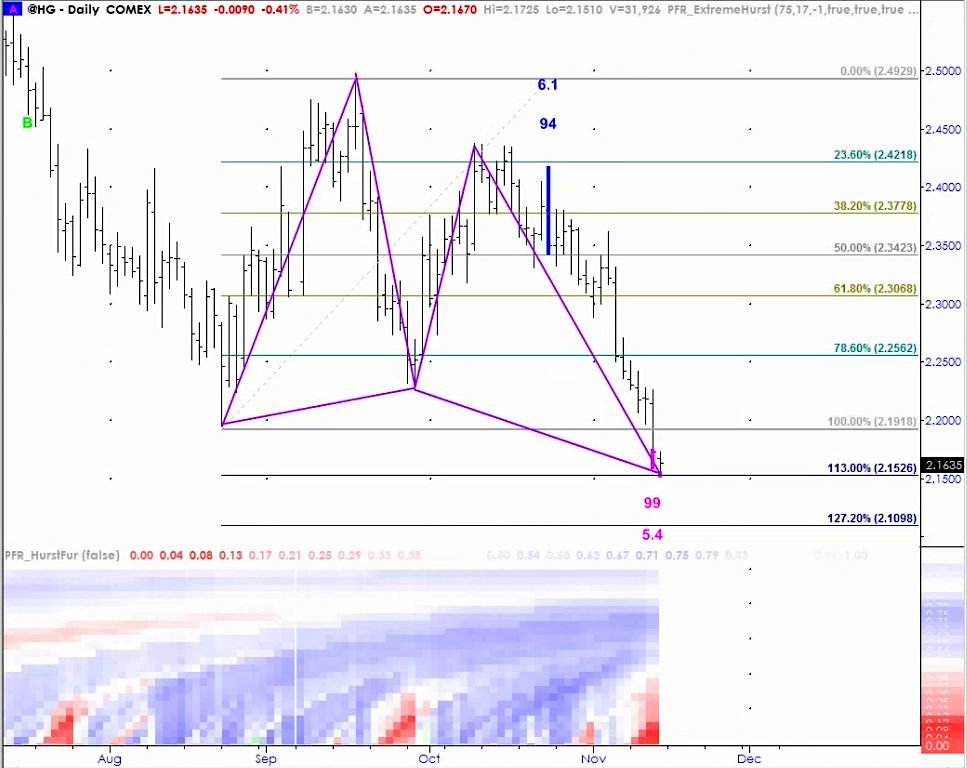
The drive lower in Copper futures has currently registered a high rank Extreme Hurst Bottom Extension. And this comes along side a bullish harmonic pattern.
Both are separate forms of pattern analysis that I have found produce a significant edge together.
Copper Futures Chart – Bullish Harmonic Pattern
Thanks for reading and have a good weekend.
Twitter: @interestratearb
The author does not have a position the mentioned security at the time of publication. Any opinions expressed herein are solely those of the author, and do not in any way represent the views or opinions of any other person or entity.


