The stock market rally in October has been a beast. It’s been relentless. But something is missing.
Several large cap stocks have pushed higher during the rally, many even gapping higher post-earnings. BUT the small caps have lagged.
Noticeably. Further, the Russell 2000 ETF (IWM) has struggled to keep pace with the broad rally over the past couple of weeks.
And after the Federal Reserve announcement on Wednesday, just when it appeared the small caps were finally set to break out higher, they failed to see follow through. And the Russell 2000 ETF (IWM) settled back in at or just under resistance.
Was this a failed Russell 2000 breakout? Or will small caps stocks regroup and play catchup?
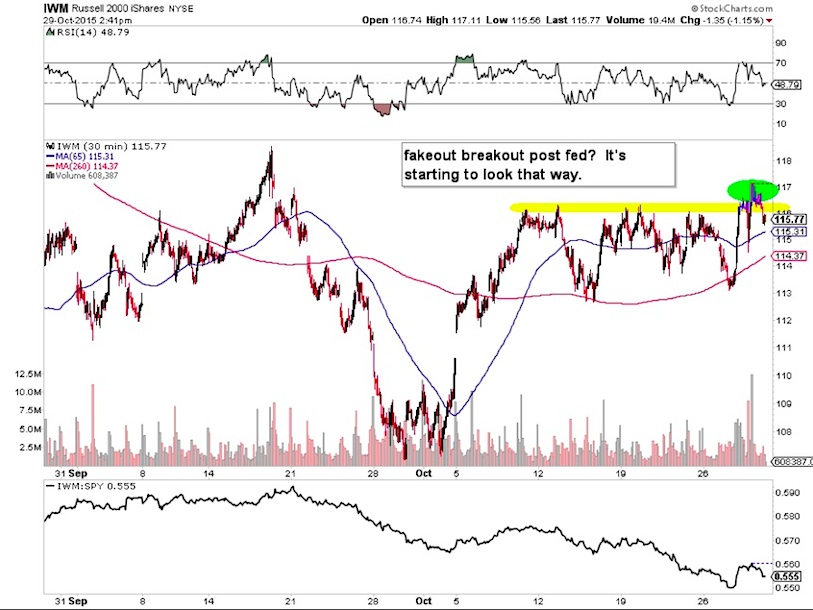
The latter may occur, but I’m thinking the former happens first. In my opinion, a quality shorting opportunity for traders took shape in Russell 2000 ETF (IWM) over the past couple of days. The gist of the trade is to be short versus the yellow shaded area. Risk (resistance) is defined. The most notable target area to shed into is 113.
Thanks for reading and trade safe!
Twitter: @ATMcharts
Author has a short position in IWM at the time of publication. Any opinions expressed herein are solely those of the author, and do not in any way represent the views or opinions of any other person or entity.
 Ready To Break Out?")


 Ready To Break Out?")