The Oil Services ETF (OIH) has fallen in lock-step with Crude Oil prices. And now that Crude Oil is back near its 52 week price lows, so it OIH. As I wrote about yesterday, I’m watching these two along with the forex pair USDCAD (US Dollar / Canadian Dollar) as I believe they will bottom as USDCAD tops at some point this year.
But, its also important to note that understanding risk levels can help traders find profits (long or short) while price patterns develop. In the case of the Oil Services ETF (OIH), price is at an interesting juncture. In late January, OIH hit a low of 31.63. That level was briefly punctured yesterday (31.51 low) but recovered to close above 32. So, like Crude Oil, it’s in a precarious situation. Either 31 and change will hold, or it will fail (more likely in my opinion).
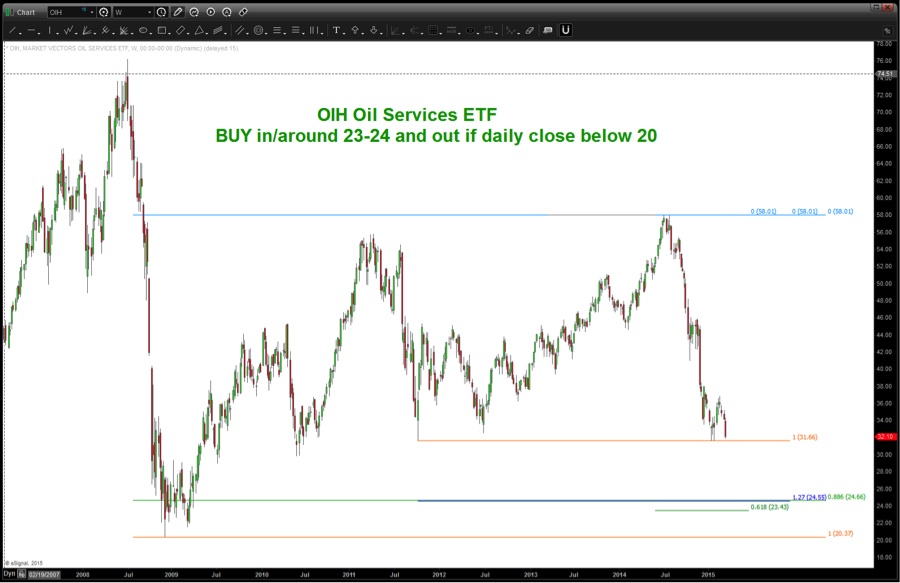
Below is a chart showing “air pocket” between current price support and the next support level at 24. Yikes.
In my opinion, 23/24 would be a higher probability entry point (with risk defined at 20 support).
Oil Services ETF (OIH) Chart
Patience is the name of the game. Let’s see how this develops.
Thanks for reading.
Follow Bart on Twitter: @BartsCharts
No position in any of the mentioned securities at the time of publication. Any opinions expressed herein are solely those of the author, and do not in any way represent the views or opinions of any other person or entity.


")

")

