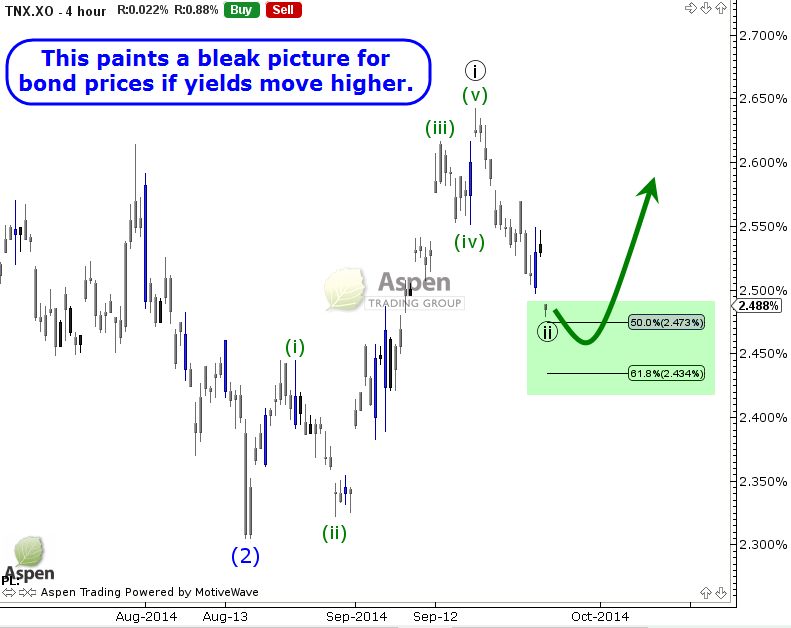
The 10 year yield continues to dip lower and is now in the ‘meat’ of Fibonacci support at 2.47%-2.43%. Only a break below 2.30% would suggest that another leg higher in bond prices is getting underway. Remember bond prices and yields move in opposite directions.
The move lower in yields this morning likely coincides with a weak tone to the the S&P 500, so we will want to see how that plays out as the North American trading session unfolds.
I am looking to get short 10-year notes, but the timing is not right….yet.
Friendly Reminder: The worst trade of 2014 has been to be short bonds (at least until the last month or so) so I am not suggesting we adopt too bearish of a stance just yet. However, yields do appear to be on the rise and if so, lower bond prices could be coming.
Let’s take a look at how things could unfold for the 10 Year Yield (TNX).
I am not involved in this trade as of yet, but will consider an outright long ProShares Ultrashort 20+ Year Treasury (TBT) to play weakness in bonds (with a risk-defined stop) or a Long December Call Vertical.
Follow Dave on Twitter: @aspentrading10
No position in any of the mentioned securities at the time of publication. Any opinions expressed herein are solely those of the author, and do not in any way represent the views or opinions of any other person or entity.


