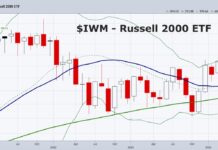
Key Stock Market ETFs Finish Q1 With Strength
The last time the Russell 2000 IWM closed out a month above the Bollinger Band we like to use, was in March 2021.
So, there...
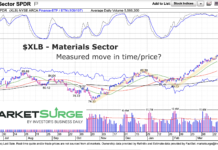
Materials Sector (XLB) Rally Reaches Trading Price Target
Most materials and hard commodities related stocks have performed well lately.
Today we look at the S&P Materials Sector ETF (XLB) to highlight the rally......
Financial Conditions Butt Heads With Borrowing Conditions
At last week’s FOMC meeting, Jerome Powell said, “We think financial conditions are weighing on the economy.”
His comments seem sensible, given the following:
The Fed...
Q2 Key Interim Corporate Data Events
The following research was contributed to by Christine Short, VP of Research at Wall Street Horizon.
It has been a solid start to 2024 with...
$DWAC Begins Trading Under Trump’s $DJT
As we might cover any new publicly traded stock, we wish to bring unbiased fundamental and technical analysis on Digital World Acquisition Corp (DWAC),...
CEO Sentiment Is Slowly Improving In 2024
The following research was contributed to by Christine Short, VP of Research at Wall Street Horizon.
CEO Optimism Abounds
After a volatile 2023, CEO confidence seems...
Can Bitcoin Rally Hold Above Key Fibonacci Level?
Bitcoin has struggle to overcome a very important price level for more than two years: the 1.618 Fibonacci extension level.
This price area is especially...
Gold Breaking Out of Bullish Inverse Head & Shoulders!
While all the headlines are focused on Bitcoin and the new highs for the major stock market indices, the price of gold is creeping...
Did Super Micro Computer Stock (SMCI) Peak and Reverse Lower?
The stock market is beginning to swerve up and down here at elevated levels. This has lead to some winners and some losers... and...
Was the Federal Reserve Dovish or Hawkish… or a Bit of Both?
The Federal Reserve kept interest rates unchanged and essentially suggested 3 rate cuts on the table for 2024.
Both the commodities and equities markets took...


