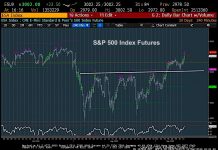
S&P 500 Pushing Higher As Important FOMC Meeting Looms
S&P 500 Index Trading Outlook (3-5 Days): Bullish
Possible stall out in and around 3000 for 1-2 days, but I expect a push higher toward 3027...
Could Black Monday Happen To Investors Again?
The 1987 stock market crash, better known as Black Monday, was a statistical anomaly, often referred to as a Black Swan event.
Unlike other...
Silver ETF (SLV) Update: All Eyes On $16 Support
In a recent article, I highlighted the rally in Silver as a bullish signal for precious metals (and gold).
In that post, I took a...
Short Poems About Value and Small Cap Stocks
Granddad Russell, a rally whoa!How much further will you go?And can your wife Gran Retail soar?Or will XRT stop at forty-four?
Hope you like my...
Natural Gas Price Reversal Higher Gives Bulls Life
This is a quick update for readers at See It Market to show how our natural gas forecast is holding up. It's working well...
Bond Yields Due For Rally After Declining More Than 1987 Crash
U.S. Treasury Bond Yields - 2, 5, 10, 30 Year Durations
The past year has seen treasury bond yields decline sharply, yet in an orderly...
Stock Market Outlook: Rotation Keeps Investors Active
The S&P 500 (SPY) flat-lined once again and closed higher by just 0.03%, but there has been significant rotation taking place below the surface...
Are Health Care Stocks Starting To Look Sick?
Vanguard Health Care Index Chart - NYSEARCA: VHT
Today's chart of the day is the Vanguard Health Care Index ETF (VHT), a broad index across...
September Stock Market Seasonality Trends Point To Rise In Volatility
Looks like the stock market rally is back on – last week markets surged to within a few percent of all-time highs.
A turbulent...
Are Bank Stocks Nearing Reversal of Fortune
The Bank Index INDEXNASDAQ: BKX has been trading in a downtrend since early 2018.
And it has been underperforming the broad stock market indices as...


