Will Dow Industrials See Decade of Flat Market Returns?
Over the years, active investors turn to several indicators to gauge market returns. And these indicators are used over varying timeframes, depending on the...
Gold Records Major Breakout Buy Signal
I continue to be bullish on Gold and Silver and select miners. Some can find some of my recent research here.
As for Gold futures,...
Is the US Dollar About To Collapse or Rally?
The U.S. Dollar got hit hard in 2020, declining nearly 7 percent (year over year) and as much as 12 percent from peak to...
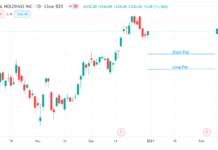
PayPal (PYPL) Stock Options Bull Put Spread Trade Idea
PayPal (PYPL) stock was one of the strongest performers of 2020 with the stock rising from 107.97 to 234.20 for a gain of 116.91%.
After...
Will Interest Rates Follow Commodities Higher In 2021?
As traders, investors and economists begin to take note of the rise in commodities prices, another related area is quietly gaining importance.
Interest rates.
In particular,...
Is Russell 2000 Reversal An Ominous Signal For Small Caps?
The Russell 2000 Index has enjoyed a multi-week run higher, giving rise to small cap stocks leadership in the broader market. However, the rally...
When Large Cap Stocks Rally, Do Small Caps Get Smaller?
With another short trading week, it’s best to stay cautious as price action can get wacky towards the year’s end.
Fund managers will rebalance their...
Advanced Micro Devices Stock (AMD) Ready To Make New Highs
Advanced Micro Devices stock (AMD) is at $91.81 and is one of our top longer-term technical trading ideas right now.
AMD is in a technical...
Have the Banks Created an M2 Monster?
While Brexit settled, stimulus checks in the US were debated and Alibaba got their hand (stock) slapped, a few other events that did not...
Is The S&P 500 Index Showing Cracks In Bullish Foundation?
S&P 500 ETF (SPY) Trading Outlook: Bullish
The S&P 500 has largely stalled out throughout much of December, but still shows no material weakness. I...


