3 Option Trade Ideas On Lululemon (LULU) Stock
Lululemon stock (LULU) has been on fire since mid-March rising from 130 to a high near 325.
Since then the stock has pulled back to...
3 Option Trade Ideas On Microsoft Stock $MSFT
Microsoft (MSFT), like most of the tech sector, has been a strong performer recently with the stock rising from 132.15 to a recent high...
2020 Providing Plenty of Volatility but Little Progress
Key Stock Market Takeaways:
- Knowing the ride keeps investors leaning in the right direction
- Consolidation could provide breadth leadership and renewed skepticism
- Copper suggest...
VIX Volatility Index: Did It Just Bottom?
In my blog last night I looked at the VIX Volatility Index INDEXCBOE: VIX
Ahead of a weekend, where more protests both peaceful and violent...
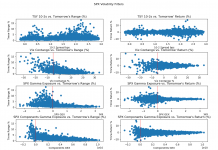
A Look at Volatility Filters Into Recent Stock Market Decline
The recent volatility, like all volatility events, has brought some traders a fortune and others pain.
The ability to identify volatility regimes is paramount!
Correct...
Uptick In Stock Market Volatility Unnerving For Investors
Stock Market Takeaways:
The S&P 500 Index INDEXSP: INX may be overstating the health of the stock market.
Most stocks have struggled since January 2018 and...
Expedia (EXPE) Offers 14.94% Return With 18.46% Margin For Error
Expedia - NASDAQ: EXPE - "daily" Stock Price Chart
Expedia (EXPE) has been on a straight shot higher since late May and is up over...
Exxon Mobil (XOM) Offers Potential 11.61% Return in 59 Days for Bullish Traders
Exxon Mobil (NYSE: XOM) Stock Chart - Options Trading
The energy sector has been struggling in recent months as the price of crude oil has...
Fire Sale On Tanger Factory Outlets Stock (SKT)
Real Estate Investment Trusts have performed very, very well in 2019 with the SPDR Real Estate ETF (IYR) rising 18.80% so far.
The Real...
Crude Oil Volatility Spike – A Classic Signal
The correction in crude oil has come as a shock to previously bullish traders and has rippled across global asset markets e.g. contributing to...


