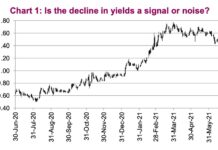
Is Bond Yields Decline An Economic Signal… Or Noise?
The SNR (signal to noise ratio) is a measurement often used in science and engineering that compares the desired signal with background noise.
This thought...
Are Copper Futures Nearing Elliott Wave Price Peak?
A 15-month rally has taken copper futures to an interesting price area. Traders who pay attention to Elliott wave patterns may wish to begin...
Is it Time to Watch the Agricultural Tech Trend?
Supply chain issues have become a common term heard throughout 2021 now that companies are struggling to bring back pre-pandemic supply levels. With that...
Gold Bulls Hope Buyers Emerge At Key Price Support!
It's been a decade of ebb and flow for Gold.
Bulls have seen the best of times (new all-time highs), the worst of times (nearly...
Is US Treasury Bonds ETF (TLT) Ready For A Pull Back?
The US treasury bond market is enjoying a multi-week rally. Bond buyers have targeted the bond market and are pressuring bond prices higher into...
Corporate Earnings Weekly Outlook & Stock Market Update – July 12
The following research was written by Christine Short, VP of Research at Wall Street Horizon.
Executive Summary - Stock Market Earnings and More
- Two earnings...
Has Stock Market Jumped From Cautious To Bullish Sentiment?
Friday the Economic Modern Family which consists of 5 sectors and 1 major Index made a quick turnaround in the small-cap Russell 2000 index...
Airlines Stocks Ready For Short-Term Rally?
Transportation stocks have struggled of late, grossly underperforming the broader stock market indices.
But they may be nearing their time to shine, at least over...
Natural Gas ETF (UNG) Nearing Initial Price Target, Top of Base
Commodities prices remain elevated and that continues to feed into the inflation talk (along with supply side issues, stimulus, and the economic recovery). Yes,...
Why is the Momentum Factor ETF (MTUM) Underperforming?
The momentum factor is the well-researched phenomenon which shows how stocks that have outperformed over the previous 6-12 months tend to outperform going forward.
So...


