Taking the Temperature of the Economic Modern Family
One of the most important first steps towards trading success is to tilt your trading towards trending sectors that display strength and avoid market...
Stocks vs Bonds: Goodbye TINA – Hello BAAA?
Sheep are timid, nervous, and easily frightened animals. For similar reasons, some fixed-income investors are often described as sheepish. Investing sheep get anxious about...
The Convergence of Market Headwinds and Mid-Term Elections
The S&P 500, represented by the ticker SPY, has generally stayed above the 200-week moving average long-term. It is a good line in the...
US Dollar Strength Has World On Edge, Big Test Here!
The US Dollar Index has propelled higher out of a double bottom formation that began in 2008... and nothing has slowed down King Dollar...
Is Dow Theory Saying Game Over for Stock Market?
Investors are really struggling to make sense of bearish, yet wide-ranging, economic data and varying analyst opinions.
Call it a sign of the times.
It's been...
Why the Stock Market Is Facing Bigger Decline
I am not an alarmist and don't use the word "crash" in my writings now or at any of the buy side firms I worked...
Don’t Be Afraid of the Fed. Let the ‘Modern Family’ of ETFs Guide You.
Wall Street sold off dramatically on Friday after the jobs report.
While the economy is stagnating, many investors are concerned that the Fed will raise...
Major Stock Market Indices Try To Form Double Bottoms
With stock markets in deep declines, traders need to stay cautious and adhere to their plans.
As the same time, it is smart to identify...
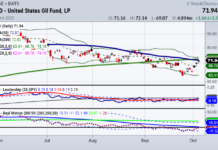
Oil, Gold, and Equities: The Battle of Supply and Demand
As predicted and we wrote about yesterday, oil prices continued to climb in anticipation of an OPEC+ production cut. Reports confirmed today that OPEC+...
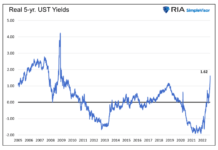
Tune Out the Financial Networks and Watch Real Bond Yields
Investors watch CNBC and CNBC’s competitors for guidance on where the markets are going. CNBC may provide insightful commentary from very qualified investors. Still,...


