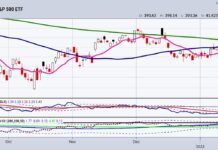
S&P 500 Index Reaches Major Test (200-day moving average)!
The S&P 500 index is once again testing its 200-day moving average. Previous tests of the 200-day in August and November of 2022 ended abruptly...
Short-Term Government Bonds Suggesting Fed Funds Peak!
In 2022, investors watched the Federal Reserve hike interest rates very quickly. And this in turn saw bond yields move much higher.
Now in 2023,...
Stock Market Reversal Warns “Bear” Is Still Lurking
This week's stock market reversal wasn't a big surprise as a number of stock market indices were trading up into either an ellipse sell zone,...
Odds Favor Lower Bond Yields In Months Ahead!
Interest rates have risen rather quickly as the Federal Reserve attempts to fight inflation.
Will the move be a case of too far, too fast?
Today's...
Coppock Curve Says Investors Should Wait For Next Bull Market
The Coppock Curve is a long-term trend-following strategy created by market strategist Edwin "Sedge" Coppock in the 1960s. It has become one of the most...
Stock Market Outlook: New Year, New Calendar Range
Welcome to the new year and the new January reset! The January 6-month calendar range could be even more influential than usual.
Let me explain...
Mish: Gold is the Featured Pick of 2023
We start this article by quoting page 55 of How to Grow Your Wealth in 2023:
“Overall, the gold futures have the lion share of our...
Nasdaq Composite: Macro Technical Guideposts To Watch
Technology stocks put in a year to forget in 2022 with the Nasdaq falling over 30 percent.
So now investors turn to 2023 and hope...
How to Grow Your Wealth in 2023!
Investors and traders must utilize sensible trading strategies, intelligent portfolio management, and vigilant risk governance to stay ahead in today's fast-paced, liquid markets.
Renowned and...
Nasdaq On The Brink Of A Larger Collapse? Watch This Support!
Despite a 33% decline in the Nasdaq, this key stock market index remains inside of this 13-year rising channel.
Barely.
Today's long-term "weekly" chart of the Nasdaq...


