We’ve been seeing some very extreme readings from the Investors Intelligence polls lately and today I want to dig in and see what it might mean. First off, the Investors Intelligence poll is officially known as the US Advisor’s Sentiment Report and it looks at over 100 independent market newsletters to assess their current stance on the market: bullish, bearish, or correction.
Like most polls, this has a contrarian nature to it – meaning once everyone goes too far in one direction that could be a signal a major change in trend is near.
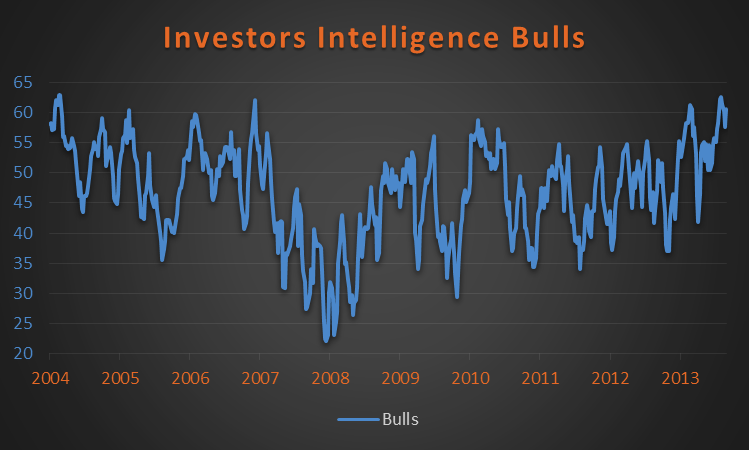
Getting right to it, we’ve seen a cluster of >60% bullish readings this year on the Investors Intelligence poll. In fact, five of the past six weeks had >60% bulls. Late last year (before a flat 1Q) and before that in ’07 (right before the Financial Crisis) were the last times we saw >60% readings.
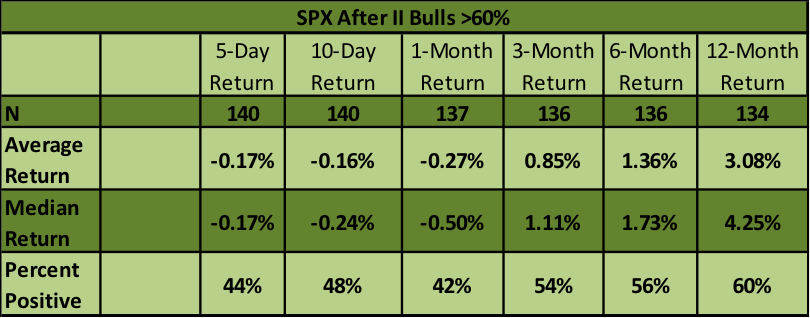
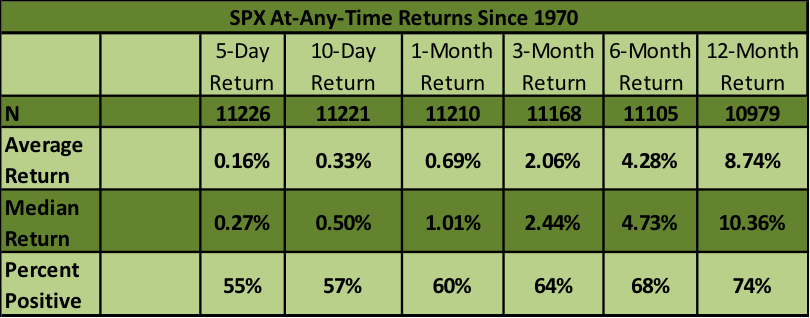
Going back to 1970, there have been 140 instances of >60% investors intelligence “bulls” (not counting the one that just happened) and the results after are below. Across the board there is underperformance out to a year on the S&P 500 (SPX).
It doesn’t end there, as bears have also been historically low. As you can see below, investors intelligence “bears” are near the lower end of their range going back a decade.
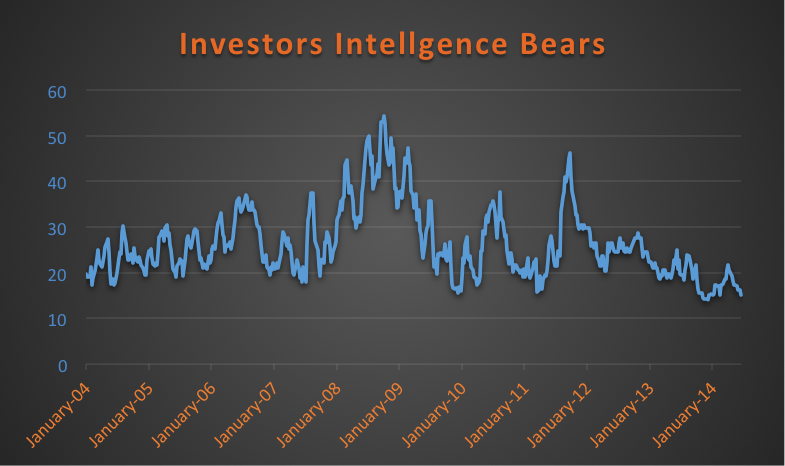
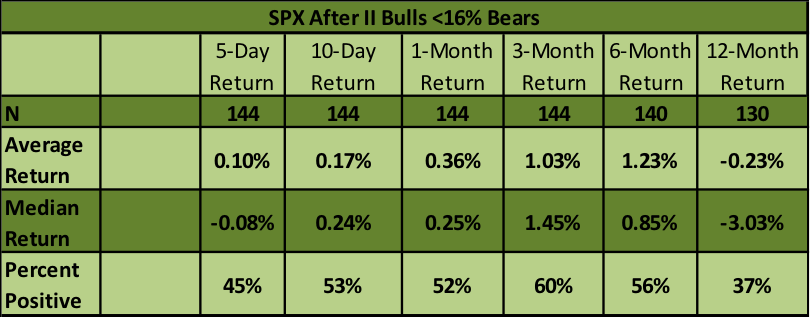
In fact, the recent week saw bears clear down to 15.2%. Again, going back to 1970, there were 144 other instances of <16% bears. Performance after this one really stands out, negative return a year later on average and up just 37% of the time! Whoa.
Lastly, if you look at bulls minus bears it was up over 45% recently (at 45.4% last week). Again, this is very rare and shows a lot of bullish newsletters out there.
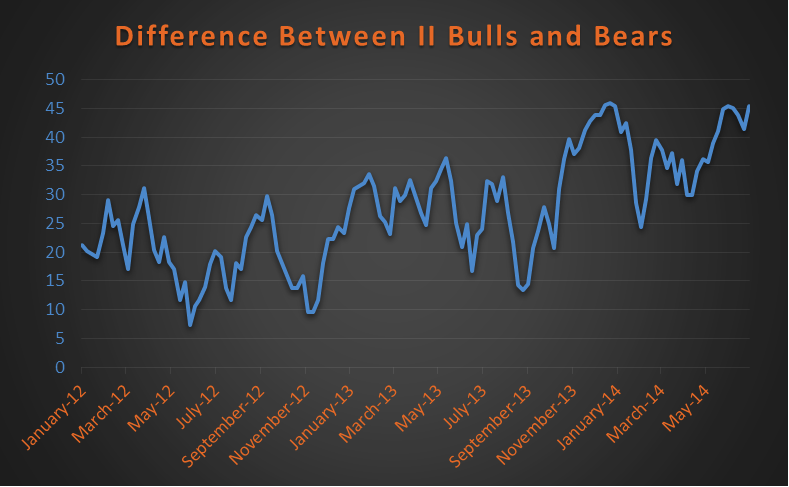
On a longer-term chart, you can see just how rare this indeed is.
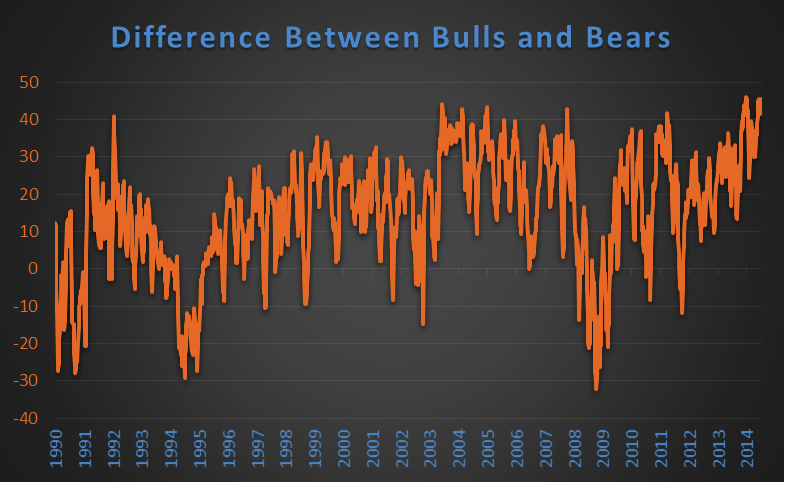
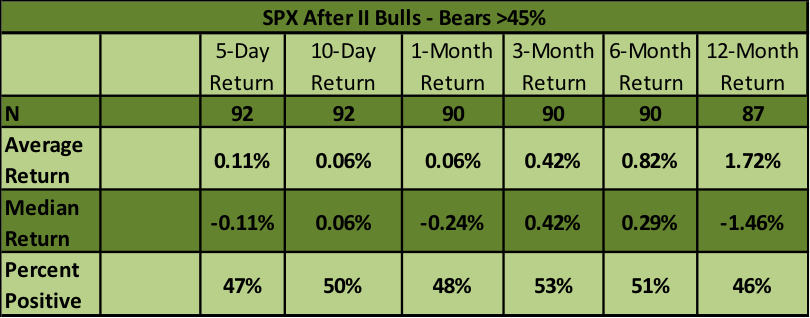
Since 1970, there have been 92 other times this has occurred within the Investors Intelligence poll data. As you’d expect, based on the earlier results, the SPX is very weak going out a year after this triggers.
This is just one bullet point and I’m very leery of making broad assumptions just on one set of data. But you can’t argue with the results: Newsletters are very bullish here and historically that isn’t a good thing.
No position in any of the mentioned securities at the time of publication. Any opinions expressed herein are solely those of the author, and do not in any way represent the views or opinions of any other person or entity.
")


