It’s been a choppy mess over the past few weeks across the major stock market indices as stocks have slugged through earnings season absent of any clear trend. And this can make trading a bit more tricky.
Ranges have compressed, the fast moving averages flattened, and the recent bear raid Thursday on critical support levels across all of the major averages has once again resulted in failure.
Bullish Divergence Shows Up
But what’s next for stocks and the broad market indices? Namely, the S&P 500, Russell 2000, and Nasdaq?
While the bulls have some confidence heading into the last full trading week of May after their successful hold of support, I want to bring to your attention some an emerging relative strength and bullish divergence across one of the major indices. Hint: It’s the Nasdaq 100, but we’ll save that chart for last so you understand the setup better.
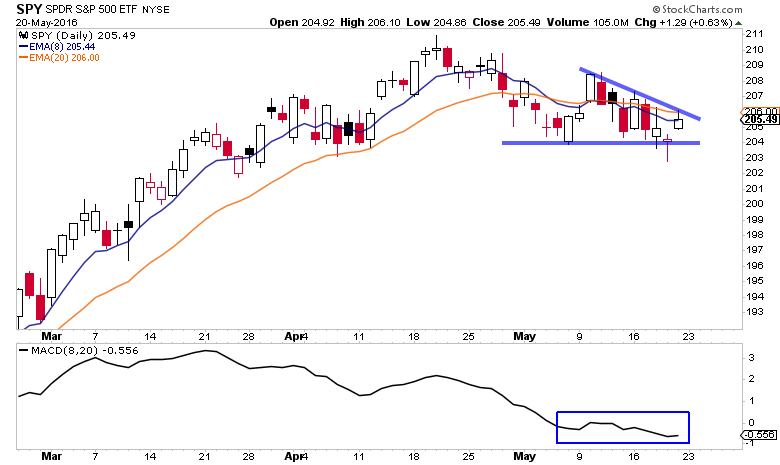
Have a look at the MACD on the following charts and take notice of the slope of the line within the blue box. Note: I use custom periods (8, 20EMAs) for MACD.
You can see the S&P 500 ETF – $SPY – showed momentum accelerating lower on this latest 204 test when compared to earlier in the month of May.
S&P 500 ETF (SPY) – Daily Chart
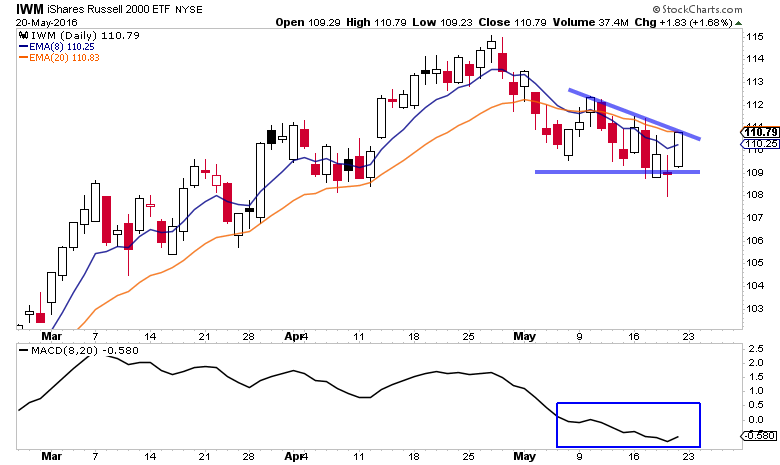
The Russell 2000 ETF – $IWM – looks very similar to the SPY, momentum accelerating lower throughout the month of May.
Russell 2000 ETF (IWM) – Daily Chart
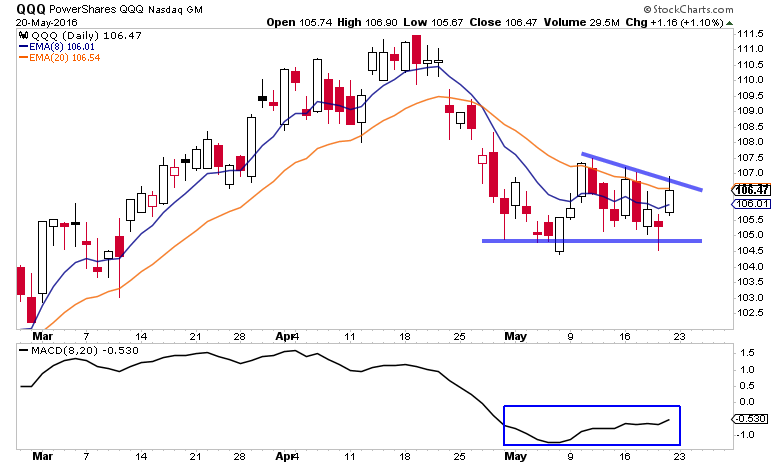
And now take a look at the Nasdaq 100 ETF – $QQQ -. You don’t see the same acceleration lower like the SPY and IWM show, in fact, you see the exact opposite: A bullish divergence higher. This has me liking the Nasdaq 100 and the Power $QQQ here for a trade.
Nasdaq 100 ETF (QQQ) – Daily Chart
As with all use of indicators, they shouldn’t be used for predicting future prices, rather used to gain context and highlight what has already taken place (and manage risk). Hopefully this added context can assist you this week planning out trades and/or navigating the markets.
Full disclosure I am long the QQQ via TQQQ and our decision to initiate that position on Thursday’s reversal was heavily influenced by the bullish divergence identified above. Thanks for reading.
Twitter: @EvanMedeiros
Any opinions expressed herein are solely those of the author, and do not in any way represent the views or opinions of any other person or entity.


