 The S&P 500 has arrived at the Fourth Inflection Point for the current bull market that began in 2009. At the previous three inflection points the index looked like it would break, but despite the consensus negative view the index stabilized and resumed the bull market.
S&P 500 | 1937 – 2013 (Monthly Chart)
As a professional trader and equity market strategist it is imperative to define the long-term trend and the influence it may or may not have on current price action. From 2010 my short-term and long-term projections for the equity market have been largely framed by the relationship of the S&P 500 with the 200-month sma and the 1937 trendline, as well as the 200-week sma. The following chart demonstrates the importance of the 1937 trendline and the 200-month sma for the S&P 500 since the late 1980’s. Click chart images to enlarge.
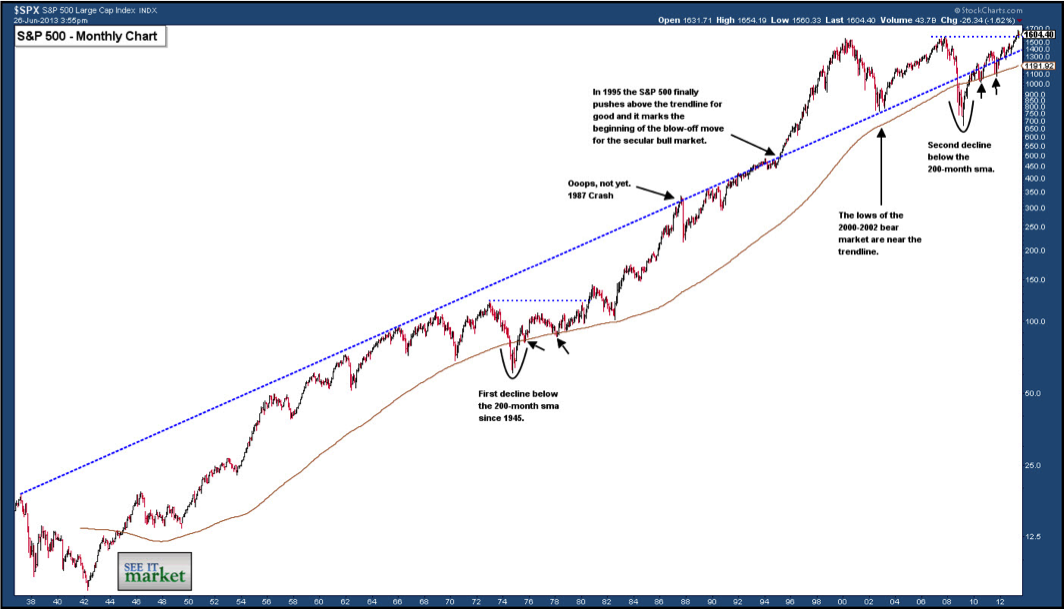
SP 500 Monthly Chart (1937-2013) Bull Market Takeaways:
- 1982 is generally defined as the beginning of the secular bull market that topped in 2000. The S&P 500 low in 1982 was near the 200-month sma.
- The 1987 crash followed the first push above the 1937 trendline. It took two years for the index to return to the trendline.
- During the 1989 – 1995 period the index generally respected the 1937 trendline before finally launching the blow-off move of the secular bull market.
- The low of the 2000-2002 bear market was in the vicinity of the 1937 trendline.
- During 2007-2009 bear market the S&P 500 declined below the trendline and the 200-month sma. It was the first time the index had traded below the 200-month sma since 1978. A clear reset for the U.S. equity market.
- The S&P 500 reclaimed the 200-month sma in 2009 and briefly the 1937 trendline in 2010.
S&P 500 | 1995 – 2013 (Monthly Chart)
The chart below magnifies the relationship between the S&P 500 with the 200-month sma and the 1937 trendline. The relationships have shaped four inflection points for the bull market that began in 2009.
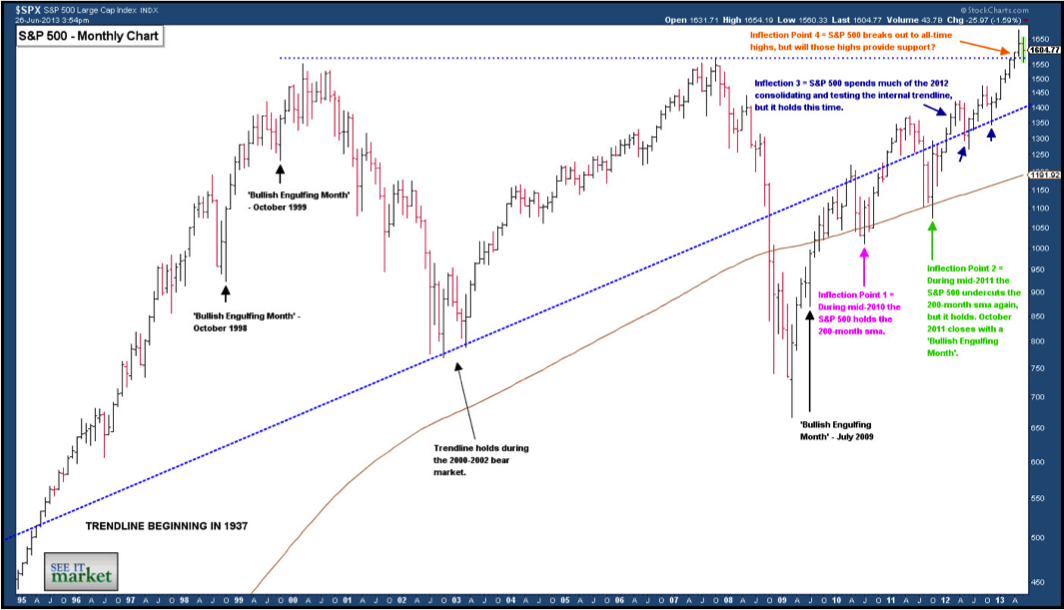
SP 500 Monthly Chart 1995-2013 Takeaways:
- In July 2009 the S&P 500 closed with a ‘Bullish Engulfing Month’ confirming a breakout from an ‘Inverse Head-and-Shoulders’ chart pattern. The S&P 500 rallied over 200 points in the next nine months. It is interesting to note that many impulsive moves to the upside for the index have followed a ‘Bullish Engulfing Month’. October 1998 and 1999 are two examples I highlighted.
- Inflection Point 1 was the first test of the 200-month sma from May 2010 to September 2010. The S&P 500 was able to find technical support. A failure to hold the long-term moving average would have left the 2009 low vulnerable. Bend, but not break.
- Inflection Point 2 was the second test of the 200-month sma at the lows of the 2011 stealth bear market. If the S&P 500 had failed to rebound it would have led to a retest of the 2010 correction lows and potentially the 2009 low. The index closed October 2011 with a ‘Bullish Engulfing Month’. It was the second engulfing month for the bull market. Bend, but not break.
- Inflection Point 3 was in 2012 when the S&P 500 spent much of the year consolidating the bull market gains and while finding support along the 1937 trendline. If the index would have failed to find support it would have increased the odds of another test of the 200-month sma. If you look at the monthly chart of the FTSE 100 in 2012 (it had been highly correlated to the S&P 500 off the 2009 low) you can see that it tested the 200-month sma for a third time before trading above its 2007 high. Bend, but not break.
- Inflection Point 4 is the current situation. In 2013 the S&P 500 successfully rallied above the 2007 high. During this current correction the index has tested the 2007 high, but is currently rebounding after the test. A decisive decline below the 2007 high could leave the S&P 500 vulnerable to a notable decline. Bend, but not break?
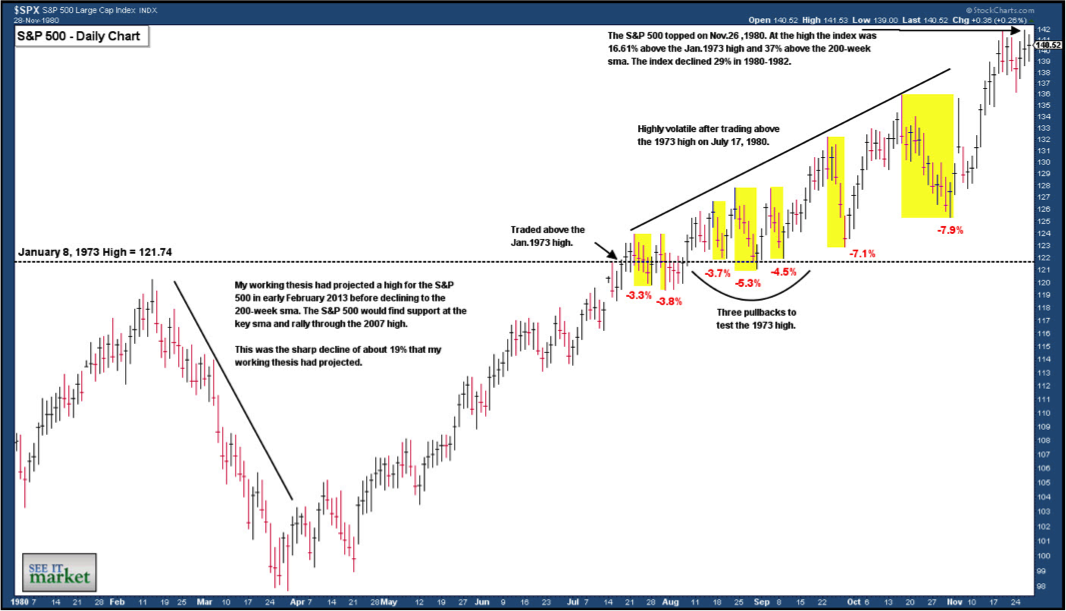
S&P 500 | 2013 (Daily Chart) & 1980 (Daily Chart)
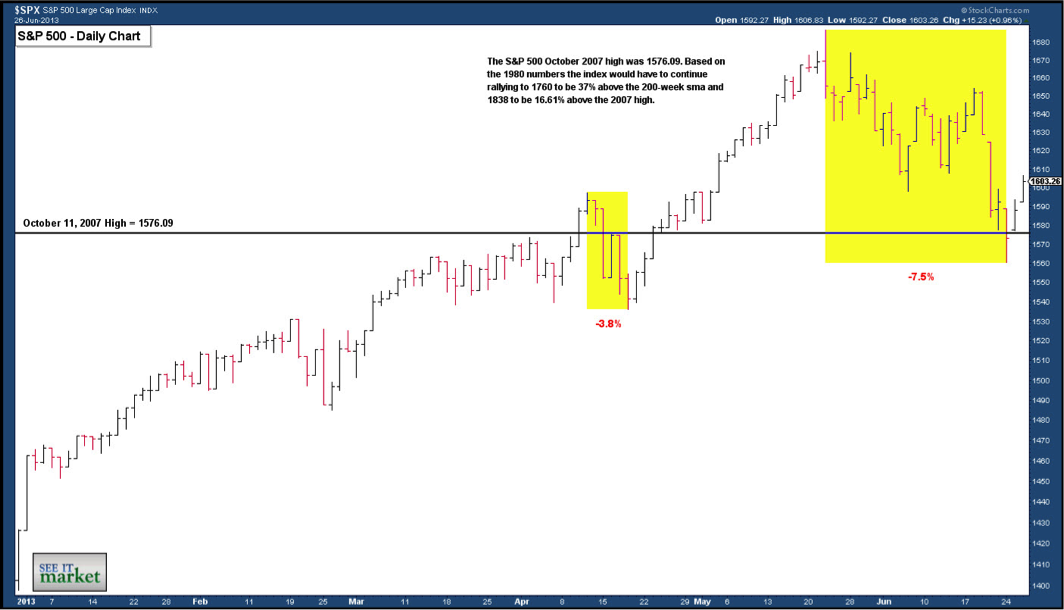
If the S&P 500 continues the theme and doesn’t break there is a high probability that the rally will become more volatile. When the index broke out above the 1973 high in 1980 the rally became increasingly volatile with a number of pullbacks ranging from -3.7% to -7.9%. However, it paid to be patient as the index finally topped in November 1980 and then declined 29% into the 1982 low. At the peak the index was 16.61% above the January 1973 high and 37% above the 200-week sma (The 200-week sma is generally considered the mean for the stock.). I use the weekly moving average to measure if the index is extended in the short-term.
If the S&P 500 doesn’t break and follows the 1980 historical precedent it could rally to 1760 which is 37% above the 200-week sma (based on today’s level) or extend the rally to 1838 which is 16.61% above the 2007 high.
SP 500 1980 Chart
The alternative scenario is the S&P 500 breaking and extending the correction from the bull market high at 1687.18. The following are the projected levels of support.
- The 1937 trendline currently sits at 1410 or a -16.4% decline.
- The 200-week sma is at 1285 or a -23.8% decline.
- The 200-month sma is at 1191 or a -29.4% decline. Note that the S&P 500 fell -29% from the 1980 high to the 1982 low. The 1982 low was in the vicinity of the 200-month and is often defined as the beginning of the great secular bull market that topped in 2000.
SP 500 2013 Chart
For those who trade off the current macro environment there is enough negative headline risk with China, Brazil and U.S. monetary policy to break the equity market. It is important to remember that in 2010, 2011 and 2012 the market was also vulnerable to building headline risk coming out of the United States and Europe, but it never broke.
Charts courtesy of stockcharts.com
Twitter: @hertcapital @seeitmarket
No position in any of the securities mentioned at the time of publication.
Any opinions expressed herein are solely those of the author, and do not in any way represent the views or opinions of any other person or entity.


")


